
@rektcapital
Crypto's methodical chartist — a pseudonymous technical analyst who reads Bitcoin through support ranges, EMAs and the halving cycle rather than hype. No permabull, no permabear: he follows the levels, and says so with dates.
In short. Rekt Capital is a pseudonymous Bitcoin-focused technical analyst with a large following on X and YouTube and a paid research service (Rekt Capital Premium). His work is chart-first: support and resistance ranges, key moving averages (the 21-week and 50-month EMAs), classic patterns (triangles, wedges), and halving-cycle timing. He's known for a disciplined, level-by-level style — flagging both downside risk and “bargain” accumulation zones — which recently caught a dip well but misjudged a summer that ran hotter than his base case.
Rekt Capital built his reputation on X and YouTube as a patient, chart-led Bitcoin analyst, turning market-cycle theory (halvings, accumulation and distribution ranges) into repeatable frameworks. He runs Rekt Capital Premium, a paid TA newsletter and community. Unlike most names in this database he trades and publishes pseudonymously — his real identity isn't public — so the brand, not a person, carries the track record.
His edge is process over prediction: he leans on the 21-week and 50-month EMAs, defined support/resistance and the rhythm of past cycles to frame risk, rather than making dramatic single price calls. That discipline reads well in choppy tape and can look flat-footed when momentum overrides the levels — as it did through this summer's rally.
Sources: youtube.com/@RektCapital · rektcapital.com · public analysis
Pure technical analysis, cycle-aware. The toolkit is support/resistance ranges (accumulation vs distribution), the 21-week and 50-month EMAs and crossovers, chart patterns (triangles, wedges, macro diagonals) and halving-cycle positioning. He frames “bargain” zones to accumulate and “breakdown” risks to respect, sizing around levels rather than conviction. Methodical and unemotional — the style's weakness is momentum: when price runs through the levels, the framework lags.
Neutral-methodical — neither permabull nor permabear; he sizes to the chart. Lately the lean was cautious, which nailed one dip but underplayed a rally that broke through his resistance.
Concrete, dated stances from his own videos, charted against Bitcoin. Rekt is a level-driven TA, so his calls are conditional (“if this support breaks…”, “this is a bargain zone”). We judged them on what price actually did next. Two good level reads in June and July, then three straight calls for a break lower through August that the tape refused while Bitcoin rallied ~25%. A rolling sample, not his multi-cycle history.
“Is Bitcoin on the cusp of breaking down from $60k? The rebounds off this support are getting weaker.”
Prices in this text as of 25 Sep 2026The dip came: from $62.7k BTC broke lower to $58.6k (−7%), just as he flagged. It then recovered hard, but the near-term breakdown call was right.
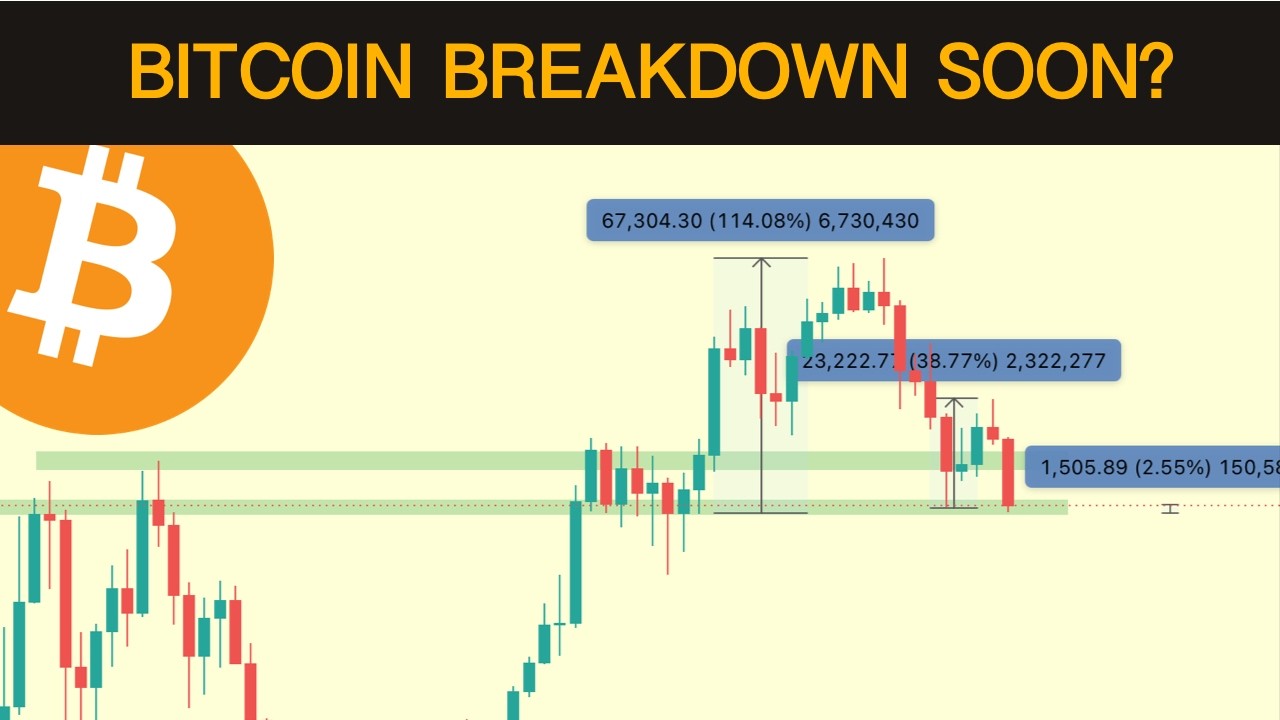 Here's Why Bitcoin Could Crash Lower▶ Watch the call · youtu.be/3I_D8NwIiTI
“This is a bargain framework — a long-term accumulation zone relative to the 50-month EMA.”
Prices in this text as of 25 Sep 2026The bargain read paid: BTC rose +17% from that zone. A clean, level-based accumulation call.
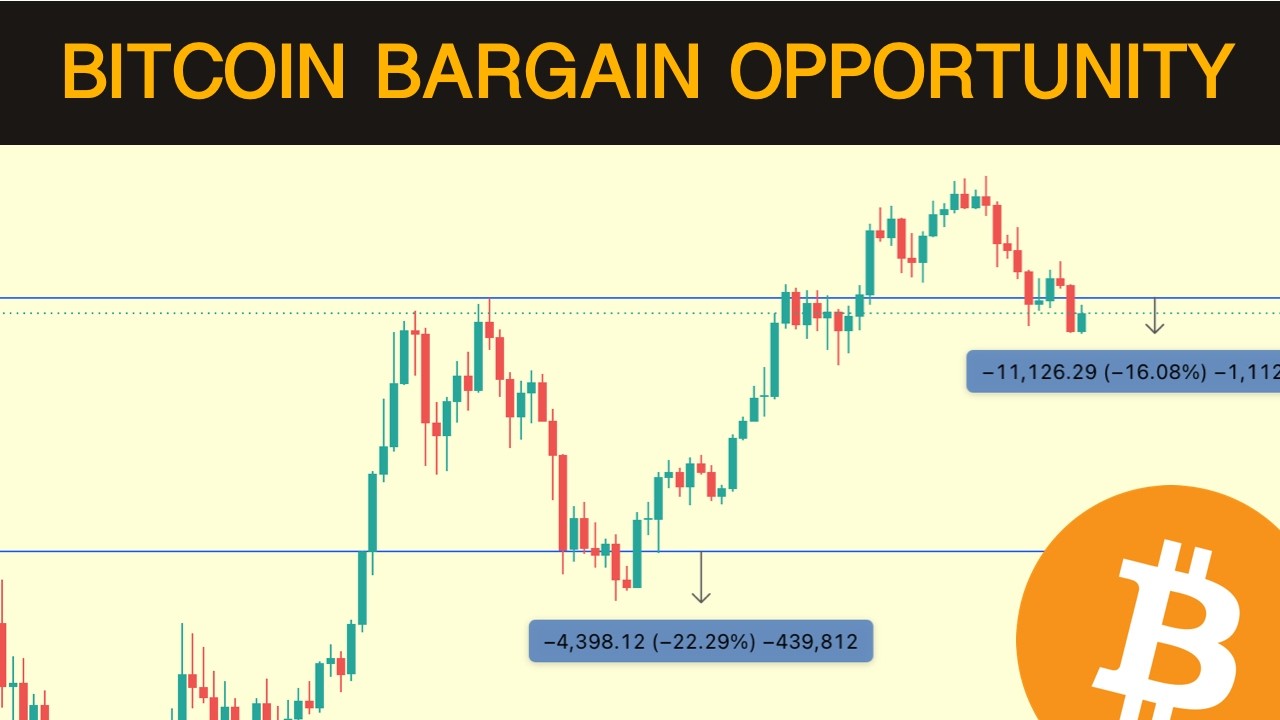 The Bitcoin Bargain Framework▶ Watch the call · youtu.be/s22yyxspRT0
“Is Bitcoin on the cusp of a new breakdown phase? Actually, we're seeing strengthening support and higher highs.”
Prices in this text as of 25 Sep 2026A two-handed take — breakdown risk vs strengthening support. From $65,344 the constructive side won: BTC dipped only to $62,773 (−3.9%), ran to a high of $86,597 (+32.5%) and trades at $84,228 (+28.9%) today. Logged open rather than scored — it is not a clean directional call.
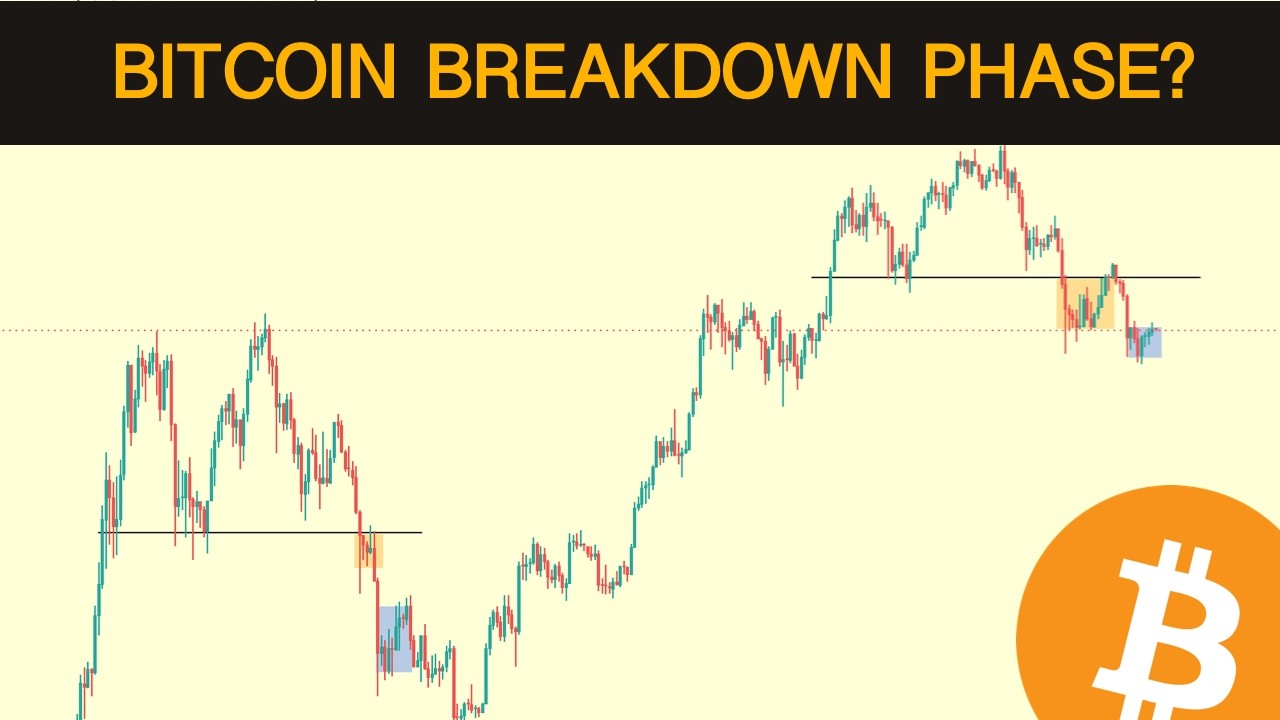 Is Bitcoin On The Cusp Of A New Breakdown Phase?▶ Watch the call · youtu.be/P0v26DCPiZ4
“A potential red August may still be developing — just like 2022, rejecting from the 50-month EMA.”
Prices in this text as of 25 Sep 2026August went the other way: BTC rallied +20% to ~$76k instead of the red month he flagged. The 2022 analogue didn't hold.
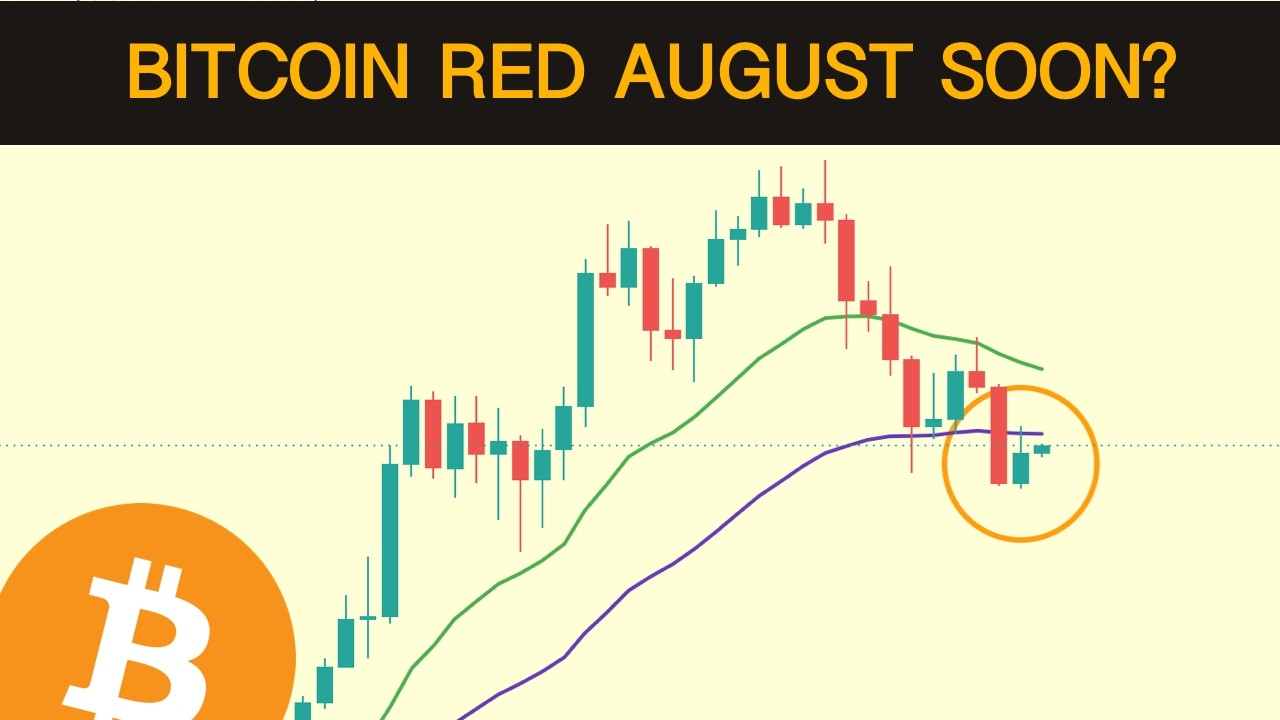 Bitcoin and Red August - My Perspective▶ Watch the call · youtu.be/BFMztI2UDQ4
“The progressively weakening support at ~$63k (orange) is clear … At some point the bounces will become so weak that the floor will simply break.”
Prices in this text as of 25 Sep 2026The floor never broke — it was the launchpad. From $63,538 Bitcoin dipped just to $62,844 (−1.1%), then ran to a high of $86,597 (+36.3%) and trades at $84,228 (+32.6%) today. The weakening-bounce sequence he measured was real; the conclusion he drew from it was not.
𝕏 PostRekt Capital on X — “the floor will simply break”↗ x.com“A rejection from $63,220 would fully confirm the breakdown and send price lower within the current ~$58,000-$66,000 Range (blue-blue)”
Prices in this text as of 25 Sep 2026He wanted a rejection to confirm the breakdown; 17 August turned out to be the low itself. $62,844 has not been revisited since (lowest after: $62,844, +0.0%) and Bitcoin ran +37.8% to $86,597, trading $84,228 (+34.0%) now — out of his $58k–$66k range to the upside, not down through it.
SourceBitcoin Copies August 2022 With Weekly Close Below 200-Week Trend Line↗ cointelegraph.com“Bitcoin is still hovering beneath the Macro Downtrending resistance, having upside wicked briefly beyond it … Still the pivotal resistance and by staying below it, Bitcoin continues its series of Macro Lower Highs.”
Prices in this text as of 25 Sep 2026Resolved against him — by his own chart. From $77,658 Bitcoin dipped only to $75,590 (−2.7%), then ran to $86,597 (+11.5%) and trades at $84,228 (+8.5%). On 21 September he wrote that Bitcoin had “officially broken to new Macro Higher Highs, invalidating the series of Macro Lower Highs” — the trendline he called the pivot gave way to the upside.
SourceBitcoin Faces A Resistance Battle As The Monthly Close Below $80,000 Approaches↗ cointelegraph.com“Bitcoin has lost the $77k level (orange) and is developing a brand new micro Lower High on price (black) … If the RSI bearish retests the Higher Low into new resistance (orange circle), that could very well confirm additional downside over time”
Prices in this text as of 25 Sep 202616 September was the low. From $75,590 Bitcoin never traded lower (lowest after: $75,590, +0.0%), ran to $86,597 (+14.6%) within days and trades at $84,228 (+11.4%) — the daily bearish divergence he flagged resolved upward, not down.
𝕏 PostRekt Capital on X — daily bearish divergences↗ x.com“Bitcoin has officially broken to new Macro Higher Highs, invalidating the series of Macro Lower Highs that persisted since October 2025 … When a Macro Downtrend ends, a new Macro Uptrend begins”
Prices in this text as of 25 Sep 2026The flip. From $81,169 Bitcoin has reached $86,597 (+6.7%), not traded below the call price, and sits at $84,228 (+3.8%). Too early to score: his own follow-up said the breakout still needs the old ~$80k range high to hold as support on a dip.
𝕏 PostRekt Capital on X — “a new Macro Uptrend begins”↗ x.comOutcomes are our read of his stated bias against BTC price, not his own scoring. TA calls are conditional and level-based; near-term marks can flip as the range resolves.
A separate record of the calls made in the videos of the Rekt Capital YouTube channel (114K subscribers). Every new video is transcribed automatically; a call counts only if its quote is found word for word in the transcript and a second checker confirms it is the speaker's own view; the outcome is scored on Binance price. These numbers are not part of the hand-checked record above.
Latest 8 of 10
“any sort of relief that we see going into the midterms, that's probably likely going to be wiped out and so there is scope for price to relief going into the midterms or on the day of the midterms whatever relief we see gets cancelled out the downside would take place”
“that data suggests to us that we still have a bit more time left in this cycle and it's still a bit more downside to go and that being said if you'd like to become a disciplined crypto investor in the next 90 days probably the most important 90 days of the cycle because we're going to be near the bear market bottom for bitcoin”
“The whole takeaway from this chart is that we see at least 50% downside on crossover to bear market bottom and we've only seen 38% downside since the crossover.”
“we tend to see downside stem from these summer ranges and once we've wasted a sufficient amount of time we'll then deviate even more into the bitcoin bargain region.”
“so we still probably have a bit more downside to go and generally speaking whenever we see a summer range develop we tend to precede additional downside over time in that regard”
“whatever upside July produces we're going to probably see that upside get cancelled out with August”
“we're in this bearish portion of the cycle for the time being which exists to downside accelerate on breakdown from the micro triangle and then search for that final bottom and so we're still in this phase here but we're slowly running out of time when it comes to bear cycles bear cycles usually last a minimum of 365 days so if we're going to be talking about a minimum of a year here then then we don't really have that much time left at all less than 90 days and you know looking to history 365 days can cut it”
“then probably 60k is going to as a progressively weakening support is probably going to break down and and maybe even turn into resistance to get us even into lower regions for this downside deviation here”
Method: automatic transcription of YouTube videos · quotes verbatim, in the original language · Binance spot, hourly candles, from the hour the video was published · window = the timeframe the speaker gave, or 30 days · not investment advice.
Rekt's product is the analysis itself — a paid TA service — so the free videos are the funnel. He doesn't shill tokens, but “subscribe for the levels” is still the business model.
Rekt Capital Premium — a paid TA newsletter and community with the detailed levels and cycle work. Free videos point to it.
Video sponsorships and charting-tool affiliations. Less token-promotion than most influencers, but still commercial.
The track record attaches to a brand, not a verifiable person — a reason to weight the process, not personality.
“This is a bargain framework — a long-term accumulation zone relative to the 50-month EMA.”
24 Jul 2026 · his accumulation discipline“The rebounds off this support are getting weaker.”
24 Jun 2026 · reading deteriorating structure“A potential red August may still be developing, just like 2022.”
04 Aug 2026 · the analogue that didn't holdQuotes transcribed from his own public sources; stated views, not recommendations.
Rekt Capital posts frequent Bitcoin TA on YouTube. Representative recent work:
The Bitcoin Bargain FrameworkHow he defines long-term accumulation zones.24 Jul 2026Here's Why Bitcoin Could Crash LowerThe deteriorating-support read before the dip.24 Jun 2026Is Bitcoin On The Cusp Of A New Breakdown Phase?Breakdown risk vs strengthening support.27 Jul 2026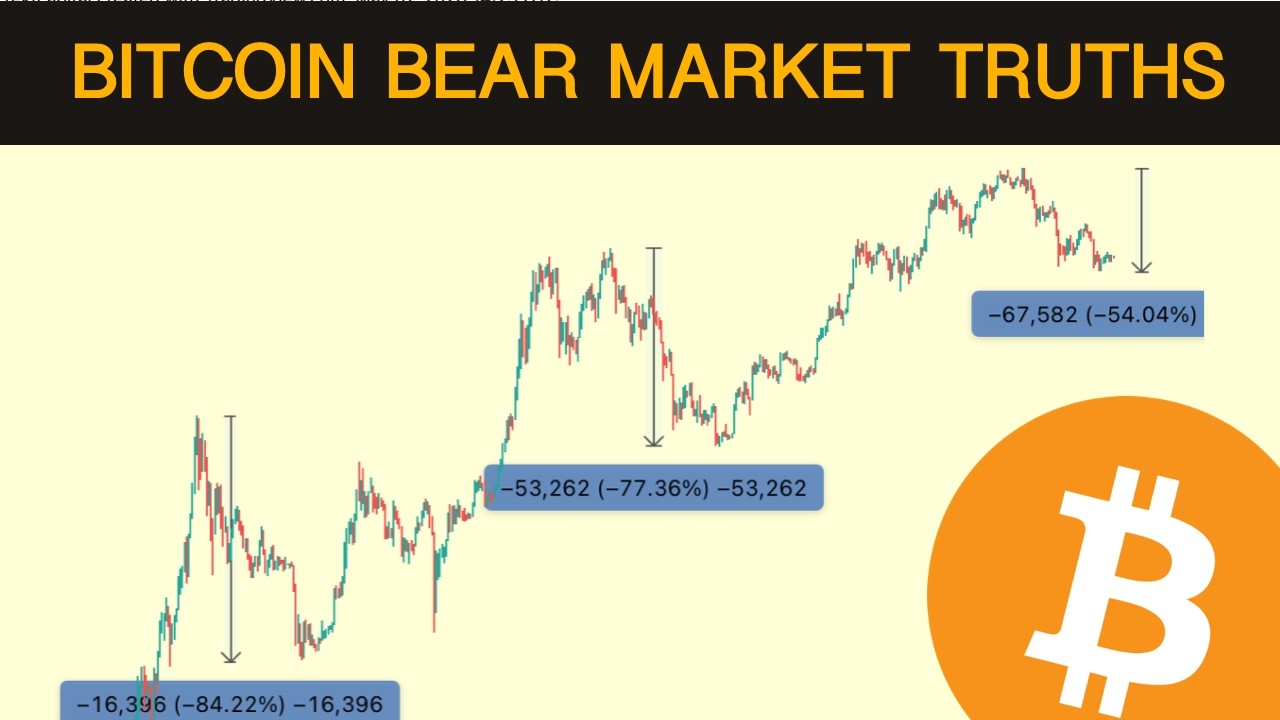 3 Things That Will Change How You See the Bitcoin Bear MarketHis market-cycle framing.12 Aug 2026
Undisclosed — Rekt Capital is a pseudonymous analyst; his real identity is not public. He trades and publishes under the brand name.
Not publicly known. He runs a paid TA subscription business plus crypto holdings, but with a pseudonymous identity there's no verifiable figure — ignore any specific number.
No known regulatory action, and he's not a token promoter — he sells technical analysis. As with any paid service, judge the framework on results, not the brand, and never trade a level blindly.
Cycle-aware technical analysis: support/resistance ranges, the 21-week and 50-month EMAs, chart patterns and halving-cycle timing. He defines accumulation “bargain” zones and breakdown risks and sizes to the levels.
Rekt trades the chart, not the mood: level-based, cycle-aware, patient, neither permabull nor permabear. How close is your instinct — measure it for real with a Trader Passport.
Now put your read to work. Test your level-based edge on live market data — no capital at risk — in a free BuyCrypt tournament with real prizes.
Informational and educational analysis based strictly on publicly available materials (his own videos and public profiles). Not financial or investment advice. Figures are approximate and change constantly. Spotted an error, or are you Rekt? Submit a correction →
Verified handles · Sources cited above · Scoring methodology · Updated 25 September 2026