
@KevinSvenson_
A chart trader who puts a number on almost every setup — a 🎯 target, a Fibonacci level, a bottom zone — and posts it with a date. That makes him easy to grade. In 2026 his bullish reversal calls landed: a $79,500 squeeze target in April and a cycle-low call at $59K in June. His March call for a bottom around $50K got the direction right but the level wrong. In October his 48-hour breakout calls for $92K Bitcoin and $3,200 Ethereum missed, and his September ETH and “bear market is over” calls are still open.
In short. Kevin Svenson posts Bitcoin and Ethereum chart analysis to about 163,000 followers on X and runs the Kevin Svenson Crypto YouTube channel. His bio lists him as CTO of AltvsBtc.com. On our sample of seven in-window posts the record is 2 played out, 3 open, 2 went against. On 15 April he targeted $79,500 from $74,297, and Bitcoin closed above it on 5 May. On 29 June, at $59,495, he said the setup “has marked every major cycle low” — Bitcoin dipped only 1.6% further and is up 37.4% since. His 26 March call for “1 more leg down” to a bottom around $50K is graded open-mixed: the leg down came, but the low was $58,566, nowhere near $50K. On 3 October he gave Bitcoin $92,000 and Ethereum $3,200 within “the next 48 hours”; neither broke out, and both are below their call prices. Outside this chart window, his 2025 top call of $140,000–$150,000 missed (Bitcoin peaked near $126K).
Svenson posts as @KevinSvenson_ on X, where his feed is mostly daily and weekly charts of Bitcoin, Ethereum and altcoin indexes, each with a pattern name and a target. He also runs the Kevin Svenson Crypto YouTube channel; Daily Hodl put it at about 83,900 subscribers in September 2025. His uploads are long “strategy sessions” on cycle structure, Bitcoin dominance and alt seasons. His X bio lists him as CTO of AltvsBtc.com, a site that charts altcoins against Bitcoin, and links two other products, agent4663.tech and TokenTicker.app, plus an exchange referral link. We found no public record of his country, age or prior career, so this page does not state them.
He also has a documented miss that sits outside this chart window. In July 2025 he told viewers Bitcoin was entering the “vertical stage” and estimated “$140,000 – $150,000” as the next top zone, “maybe around October”. In September 2025 he repeated $140,000–$150,000 with a top around November to January. Bitcoin topped near $126,000 in October 2025 and then fell into the 2026 bear market. His timing of the peak was close; his level was not. Pronouns on this page follow press usage (Daily Hodl writes “he”); he has not stated them himself.
Sources: x.com/KevinSvenson_ (captured via api.fxtwitter.com and X syndication) · YouTube channel UCVTbGN6Hzi4sSAz1bKHiDiQ · dailyhodl.com coverage (2025)
Classical chart patterns with explicit targets. He names the pattern (continuation, short-squeeze setup, rejection candles), marks the trigger, and posts a 🎯 target, often tied to a Fibonacci extension such as the 1.272. On longer timeframes he leans on cycle analogies — parabolic-curve bases, “every major cycle low for 15 years” — and sentiment extremes. The strength is that his calls are falsifiable: a number and a date. The weakness shows on cycle-scale levels: the $50K bottom and the 2025 $140,000–$150,000 top were both off by well over 10%, even when the direction was right. Short windows cut both ways too: his October 48-hour breakout calls for Bitcoin and Ethereum missed.
Bullish since the summer low. He called the cycle low on 29 June and declared the bear market over on 21 September. In this sample his only bearish call was the March “1 more leg down”, which he framed as the last drop before a year of accumulation. He stayed bullish into October, calling $92K Bitcoin on 3 and 6 October and saying on 12 October the weekly close was “in the bulls favor now”.
Seven dated posts from @KevinSvenson_, each captured verbatim from X and charted against real price. The tally is 2 played out, 3 open, 2 went against. The wins are the $79,500 squeeze target in April and the cycle-low call at $59,495 in June. The misses are his 3 October 48-hour breakout calls: $92,000 Bitcoin and $3,200 Ethereum. His March call for a $50K bottom is graded open-mixed: the leg down happened, the level did not. The September ETH target and the “bear market is officially over” call are still open, and both are back near or below their call prices.
“A push through local highs puts $92K in play. The chart says breakout in the next 48 hours.”
A “next daily target” of $92,000, about +8.9% above Bitcoin's $84,506 mark that day, with a 48-hour window for the breakout. Bitcoin's best mark after the post was $86,490 (+2.3%) on 5 October, still under the 22 September local high of $86,597. He repeated “$92,000 🎯 on next leg up” on 6 October, at $85,771. The breakout did not come: Bitcoin fell to $81,408 (−3.7%) and sits at $81,764 (−3.2%), with $92K still 12.5% away. On daily marks the 48 hours passed without the breakout, so we grade it went against.
𝕏 Post“$92,000 #Bitcoin 🟠 next daily target 🎯” — @KevinSvenson_ on X↗ x.com“A break of local highs puts $3,200 in play. Same window as Bitcoin: the next 48 hours decide.”
The Ethereum half of the same thread: a break of local highs would put $3,200 in play, about +19.9% above ETH's $2,668 mark, within the same 48 hours. ETH peaked at $2,726 (+2.2%) on 5 October, below its 22 September high of $2,775. It then dropped to $2,400 (−10.0%) and sits at $2,418 (−9.4%). The 48 hours passed without the break, and price fell — went against.
𝕏 Post“#Ethereum🔹 is tracking the same daily structure.” — @KevinSvenson_ on X↗ x.com“The bear market is officially over.”
A regime call, posted with “bull market loading” for Bitcoin, Ethereum and altcoins. Bitcoin was at $81,169, and that day's mark is still the floor: it has not closed lower since. It ran to $86,597 (+6.7%) the next day, but gave it all back: the lowest mark since is $81,408 on 18 October, and Bitcoin sits at $81,764 (+0.7%). Four weeks on it is flat, not a bull market yet, and not a new low either — open.
𝕏 Post“The bear market is officially over.” — @KevinSvenson_ on X↗ x.com“#ETHEREUM 🔷 Daily Chart Continuation pattern 🎯 Target = $3,380”
A daily-chart continuation pattern with a $3,380 target, about +36% above Ethereum's $2,485 mark that day. So far ETH dipped to $2,397 (−3.5%), then rose to $2,775 (+11.7%) on 22 September, but has slid back to $2,418 (−2.7%), below the call price. The target is now 39.8% away. Still open, but leaning against him.
𝕏 Post“#ETHEREUM 🔷 Daily Chart Continuation pattern 🎯 Target = $3,380” — @KevinSvenson_ on X↗ x.com“This exact setup has marked every major cycle low for $BTC for the last 15 years. It's time to start betting against the crowd”
With Bitcoin at $59,495, in “Extreme Fear” and below its two-year cost basis, he called a cycle-low setup and said to bet against the crowd. It was within a whisker of the bottom: Bitcoin dipped only −1.6% to $58,566 on 1 July, its 2026 low, then ran to $86,597 (+45.6%). It sits at $81,764 (+37.4%). Played out.
𝕏 Post“This exact setup has marked every major cycle low” — @KevinSvenson_ on X↗ x.com“If we reclaim and confirm price action above yesterday’s wick high, a trapped liquidity short squeeze initiates. Targeting 🎯 $79,500 (coincides with 1.272 Fib)”
A conditional short-squeeze setup from $74,297, with a $79,500 target (about +7%). Bitcoin dipped to $73,841 on 20 April, then closed above the target at $79,826 on 5 May and peaked at $82,018 on 11 May. The squeeze did not last: Bitcoin fell to $58,566 (−21.2%) by 1 July. The target was hit — played out.
𝕏 Post“Targeting 🎯 $79,500 (coincides with 1.272 Fib)” — @KevinSvenson_ on X↗ x.com“1 more leg down seems about right. Then a bottom will form around $50K, we exit the downtrend, and we enter general accumulation for the rest of the year.”
From $71,304 he expected one more leg down to a bottom around $50K. Bitcoin first rallied to $82,018 on 11 May, then made that leg down to $58,566 (−17.9%) on 1 July, and has recovered to $81,764 (+14.7%). The shape he described happened — a final drop, then a turn — but the floor came in $8,566 above his level. Bitcoin never got near $50K. We grade it mixed: direction right, level wrong.
𝕏 Post“Then a bottom will form around $50K” — @KevinSvenson_ on X↗ x.comOutcomes are our read of his stated claim against real price, not his own scoring. Every quote is a verbatim X post, linked on its card and reproduced in full in the verified corpus. Prices are CoinGecko daily marks, so an intraday post is measured from that day's mark, and a wick through a level may not appear. The “$1,000 in on their call” line on this page is buy-and-hold from the call date; it does not model shorting. His 2025 $140,000–$150,000 top call is outside the price window and is not charted, but it is described in the background. Near-term marks can flip as the cycle resolves.
Svenson's business mixes content with products and an exchange partnership. None of it is hidden — it is in his X bio and his own posts — but it is worth knowing before you act on a chart.
His X bio and many of his chart posts carry a BloFin partner link (partner.blofin.com/d/KevinSvenson), and his YouTube channel has a BloFin spot-and-futures tutorial. Referral links typically pay the poster a share of the trading fees of people who sign up, and futures trading generates more fees than holding.
His bio lists him as CTO of AltvsBtc.com and links TokenTicker.app and agent4663.tech. He promotes these in his posts; for example, on 28 September he pitched TokenTicker as the easiest way to see which tickers are moving. We did not find public pricing for them.
He also launches crypto tokens. On 26 August he posted “I launched a meme coin that airdrops $NVDA, $TSLA, $AMZN, $AAPL, and $SPY stock tokens simply by holding the token” — $StonkATM, on Robinhood Chain, which charges traders a fee when they sell. On 28 September he posted that “$TICKER holders will get access to paid features post graduation”, linking a Pons launchpad page, and his feed reposts other Pons launchpad tokens. A launcher can gain when his audience buys; we found no public disclosure of what he holds.
The Kevin Svenson Crypto channel earns from views and any sponsorships. Bullish, high-energy titles (“The Bull Market Starts NOW?!”) tend to draw more views, which is a general incentive to keep in mind.
“This exact setup has marked every major cycle low for $BTC for the last 15 years. It's time to start betting against the crowd”
29 Jun 2026 · the cycle-low call that held“Then a bottom will form around $50K”
26 Mar 2026 · the level that never came“The bear market is officially over.”
21 Sep 2026 · the regime call still openQuotes transcribed from his own public sources; stated views, not recommendations.
Svenson publishes long chart sessions on his Kevin Svenson Crypto YouTube channel. Representative recent uploads:
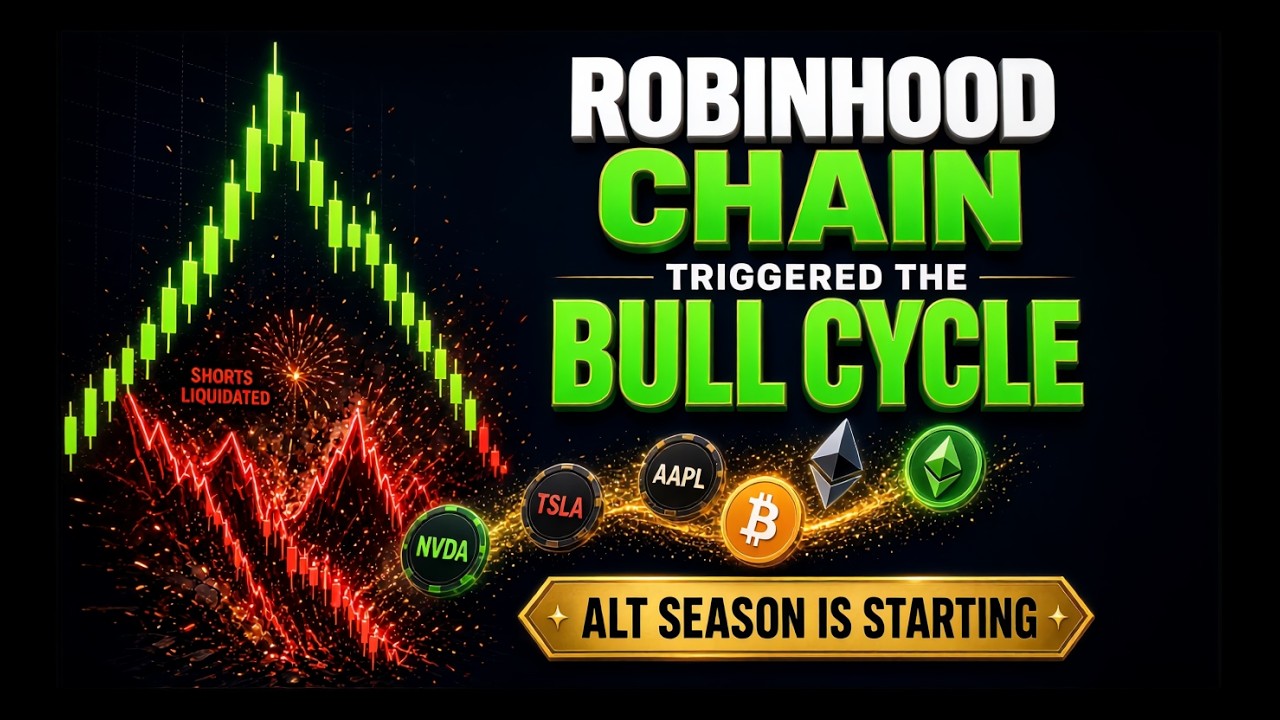 Robinhood Chain Triggered the Next Bull Cycle — Alt Season Is Here #Bitcoin #Ethereum #RobinhoodHis case that the alt cycle has started.11 Sep 2026
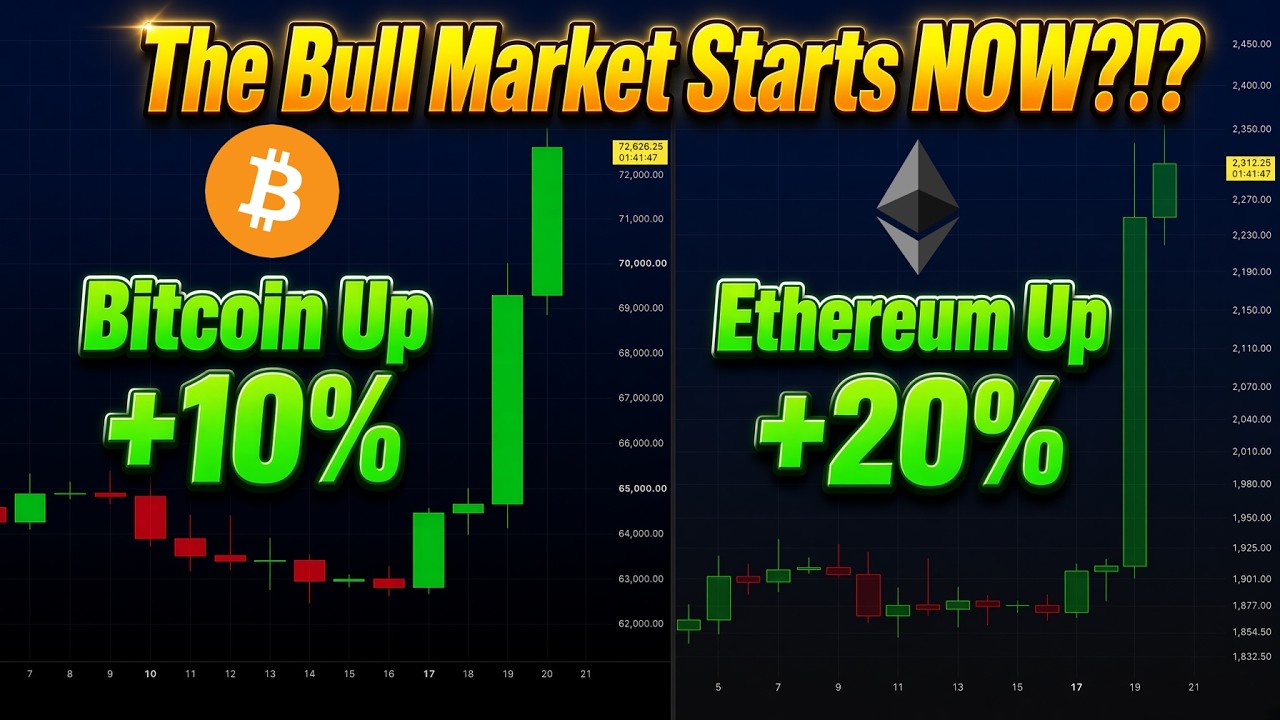 #Bitcoin +10% & #Ethereum +20% – The Bull Market Starts NOW?!The August rally, read as the start of a bull leg.20 Aug 2026
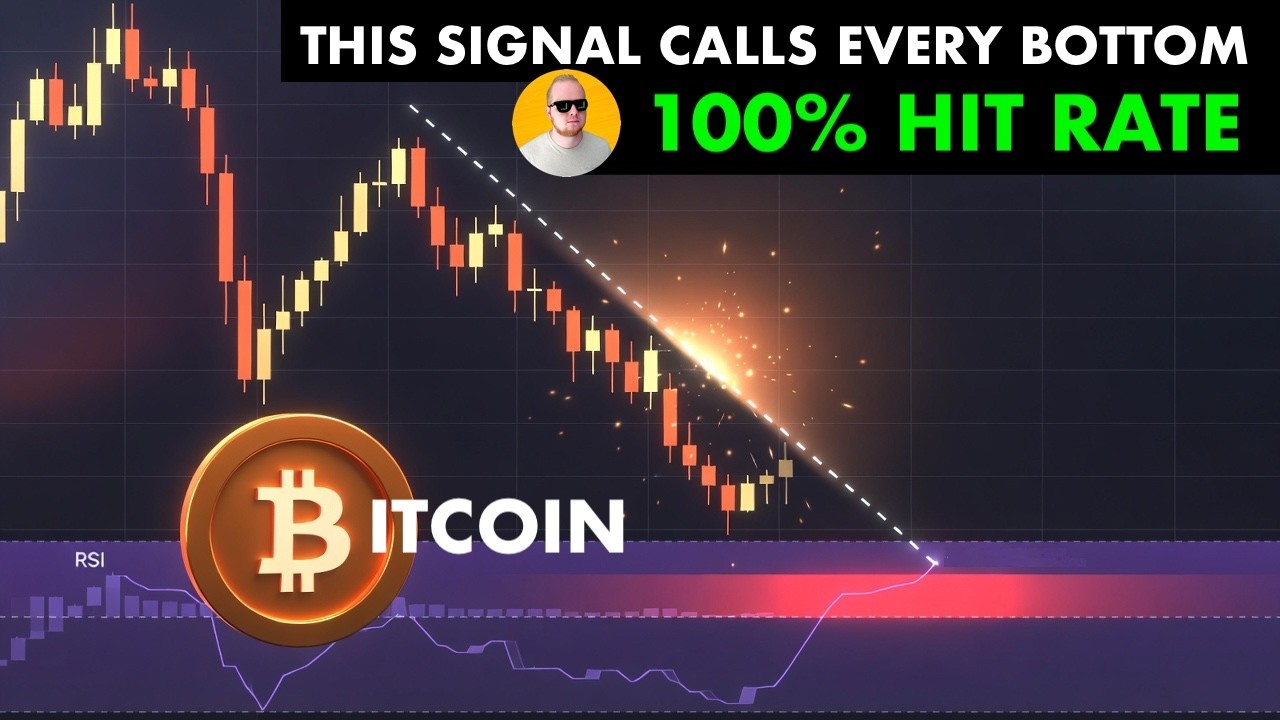 This #Bitcoin Bottom Signal Has NEVER Been WrongThe cycle-low signal behind his 29 June call.3 Jul 2026
 BIG SHIFT COMING FOR #BITCOIN #STOCKS $ALTS $ONDO $LINK $HYPECross-market view near the May highs.8 May 2026
A crypto chart analyst who posts Bitcoin and Ethereum setups with explicit targets to about 163,000 followers on X (@KevinSvenson_) and runs the Kevin Svenson Crypto YouTube channel. His X bio lists him as CTO of AltvsBtc.com.
On our sample of seven dated 2026 posts: two played out, three are open, two went against. His April $79,500 target was hit on 5 May, and his 29 June cycle-low call came within 1.6% of the 2026 low. His 3 October calls for $92,000 Bitcoin and $3,200 Ethereum within 48 hours missed. His March call for a bottom around $50K missed the level (the low was $58,566), and his 2025 top target of $140,000–$150,000 missed (Bitcoin peaked near $126,000).
Indirectly. His posts and bio carry a BloFin exchange referral link, he promotes his own products (AltvsBtc.com, TokenTicker.app), he has launched his own tokens ($StonkATM in August 2026), and he earns from YouTube. We found no paid signal group.
Classical chart patterns with a trigger and a 🎯 target, often a Fibonacci extension, plus cycle analogies and sentiment extremes for the bigger picture. His record on near-term targets is mixed: two hits (April and June) and two 48-hour misses (October). His cycle-scale levels have been further off.
Svenson trades the pattern and posts the number. How close is your instinct? Measure it for real with a Trader Passport.
Now put your approach to work. Test your edge on live market data with no capital at risk in a free BuyCrypt tournament with real prizes.
Informational and educational analysis based strictly on publicly available materials: dated X posts captured from X's public endpoints and the sources linked on each call. Not financial or investment advice. Figures are approximate and change constantly. Spotted an error, or are you Kevin? Submit a correction →
Verified handles · Sources cited above · Scoring methodology · Updated 18 October 2026

















