
@CarpeNoctom
An Ichimoku chartist who runs trading at the crypto ETF issuer Canary Capital and posts short, dated chart calls to about 149,000 followers. In 2026 his turns were mostly well timed. On 29 May, with Bitcoin at $73,652, he said it was probably headed for a 200-week moving average test, and six days later it was there. His April title “Here's How $BTC Hits ATH in 2026” is still a long way off, his September “M top” call was followed by a breakout, and he dropped his 6 October “rdy to rock” setup himself the next day.
In short. Josh Olszewicz trades Bitcoin and Ether from the Ichimoku cloud and classic chart patterns, and posts the setups on X as @CarpeNoctom. On our sample of eight in-window posts the record is 5 played out, 1 open, 2 went against. The best call was the bearish turn of 29 May: from $73,652 he expected a test of the 200-week moving average, which came on 4 June at $64,047 (−13.0%). He also called the July inverse head-and-shoulders target of 70k+ and Ether's August breakout (+32.2% in two weeks). The misses were the 11 September M top, which pointed to $70k–$72k while Bitcoin went to $86,597 instead, and a 6 October 4-hour breakout call that he abandoned the next day (“so much for that”). His 20 April title, a path to a new all-time high in 2026, is still open.
Josh Olszewicz is VP and Head of Trading at Canary Capital, a US asset manager that issues crypto ETFs. His X bio reads “Canary.Capital PM & Head of Trading”. According to Canary's own team page, he previously headed crypto research at BraveNewCoin, was a portfolio manager at Techemy Capital and served as Head of Research at Valkyrie Investments. Before crypto he taught lab sciences at university level, and he holds a BS in Human Biology and an MS in Biotechnology. He has been on X as @CarpeNoctom since March 2009.
His output follows a weekly rhythm: a “Setup Sunday” video, a “Macro Monday”, an “Alt Coins” show and a Friday “Broad Market Review” livestream, plus weekly posts on CME Commitments of Traders (CoT) data and US spot ETF flows. Most of his chart posts cover stocks as well as crypto. This page grades only his Bitcoin and Ether calls, because those are the prices the site tracks.
He also discloses a miss of his own. On 3 June 2026 he reposted his March 2018 post “ya, still on track for 33k by July” with the line “Heroes get remembered but bad calls never die”. Bitcoin did not come close to $33k in 2018. His weekly CoT posts read the data as bearish for most of the window, including through the July–September rally. We treat those as data reports, not price calls, and do not chart them. Eight posts qualified as calls, and several more were examined and excluded. Each is listed with its reason in the verified corpus.
Sources: x.com/CarpeNoctom (captured via api.fxtwitter.com and X syndication) · canary.capital/about · canaryetfs.com · linktr.ee/carpenoctom · YouTube oEmbed
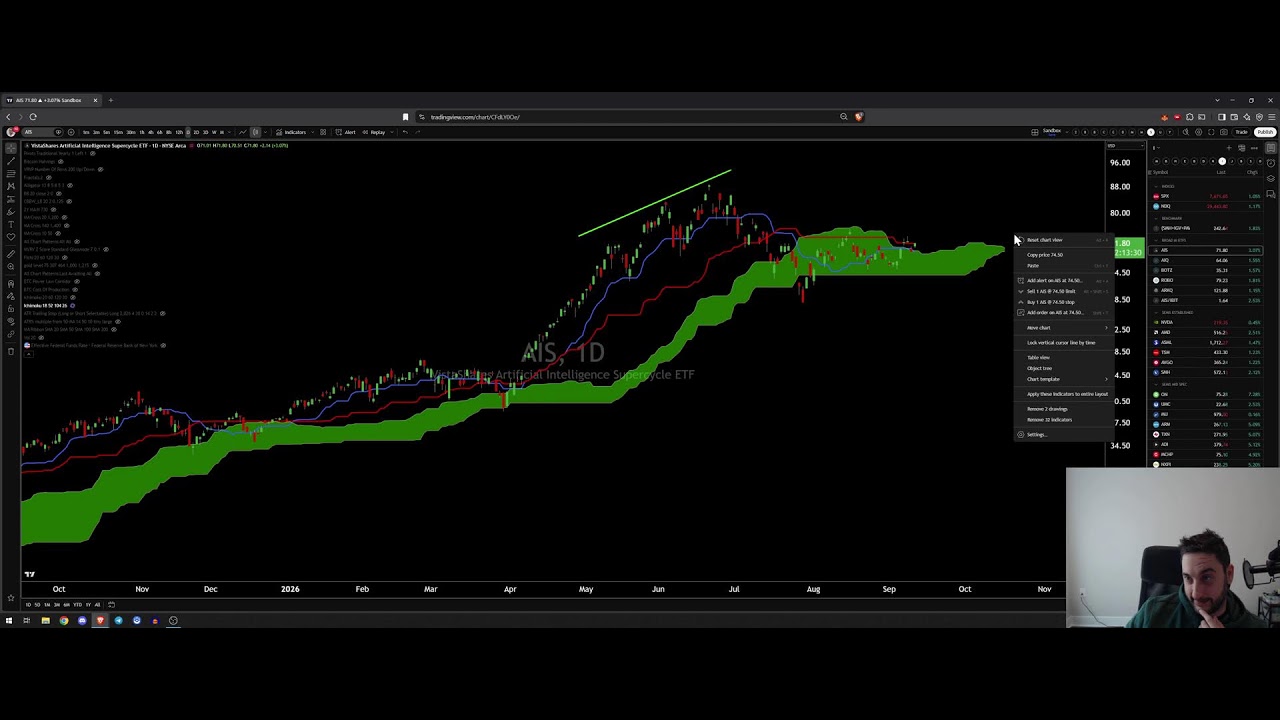
The cloud decides. Olszewicz reads trend from the Ichimoku cloud (“kumo”): above it is bullish, below it is bearish, and a breakout through it is a signal. He combines it with classic patterns: head-and-shoulders and inverse head-and-shoulders, double tops (“M”), falling wedges, and Fibonacci targets. Most posts are one line and a chart, with a target or an invalidation level. That makes them easy to grade. The strength is turning with the trend: in this sample he flipped bearish just before the June leg down and bullish again before the August breakout. The weakness is the pattern that never triggers: the September M top read a stall as a top.
Close to neutral, and it changes with the chart. He was bullish in April and early May, turned bearish on 29 May below the daily cloud, turned bullish again in July and August, then flagged a possible top in September. On 30 September he wrote that he had “never seen Q3 this bullish”.
Eight dated posts from @CarpeNoctom, each captured verbatim from X and charted against real price. The tally is 5 played out, 1 open, 2 went against. The record is strongest at the turns: the 29 May call for a 200-week moving average test, the 5 June “no bottom yet”, the 20 July 70k+ target and Ether's August breakout all played out. The 11 September M top and the 6 October “rdy to rock” setup went against, and the April all-time-high title is still open.
“4h $BTC looks rdy to rock (iHS)”
A bullish inverse head-and-shoulders on the 4-hour chart, posted at $85,771, the day after Bitcoin's October high. Four hours later he corrected his own post to “looked*”, and on 7 October he added: “well, so much for that, on to the next trade”. No higher daily mark followed. Bitcoin fell to $81,686 (−4.8%) on 9 October and $81,408 (−5.1%) on 18 October, and it is at $81,810 (−4.6%) now. He called the miss himself, within a day. Went against.
𝕏 Post“4h $BTC looks rdy to rock (iHS)” — @CarpeNoctom on X↗ x.com“looks like a potential M top here, downside fibs = 70-72”
A bearish double-top read on the daily chart, posted at $76,555, with Fibonacci targets at $70k–$72k. The drop did not come. The lowest daily mark after it was $75,590 (−1.3%) on 16 September, far from the targets. A week later Bitcoin broke out to $86,597 (+13.1%), and it is at $81,810 (+6.9%) now. Went against.
𝕏 Post“looks like a potential M top here, downside fibs = 70-72” — @CarpeNoctom on X↗ x.com“ethereum:native prepping for breakout”
A breakout call on Ether, posted at $1,902 after weeks of sideways trading. It dipped to $1,871 (−1.6%) on 11 August, then broke out: $2,515 (+32.2%) on 22 August and $2,775 (+45.9%) on 22 September. It has since fallen back to $2,403 (+26.3%). Played out.
𝕏 Post“ethereum:native prepping for breakout” — @CarpeNoctom on X↗ x.com“a small nudge and $BTC is in full breakout territory iHS target = 70k+”
An inverse head-and-shoulders target, posted at $64,670. The nudge took a month. Bitcoin first slipped to $62,773 (−2.9%) on 2 August. It then closed above $70k for the first time on 21 August at $73,021 (+12.9%), and kept going to $86,597 (+33.9%). It is at $81,810 (+26.5%) now. Played out.
𝕏 Post“a small nudge and $BTC is in full breakout territory” — @CarpeNoctom on X↗ x.com“$BTC pi cycle bottom suggests more no bottom yet”
A cycle-indicator read, posted at $63,811 the day after Bitcoin hit its 200-week average. More downside followed: $60,855 (−4.6%) on 7 June, and the 2026 low of $58,566 (−8.2%) on 1 July. Only then did the bottom form. Bitcoin went on to $86,597 (+35.7%) and is at $81,810 (+28.2%) now. Played out.
𝕏 Post“$BTC pi cycle bottom suggests more no bottom yet” — @CarpeNoctom on X↗ x.com“if channel support doesnt save this then we are probably headed for a 200WMA test bearish lean negated if/when price >79k above cloud”
The bearish turn, posted at $73,652 with Bitcoin below the daily cloud and breaking a head-and-shoulders. Channel support did not hold. On 4 June Bitcoin marked $64,047 (−13.0%), and he posted that it had reached the 200-week moving average for the first time since October 2023. It bottomed at $58,566 (−20.5%) on 1 July. The invalidation level, a close above $79k, came only on 27 August at $79,018, three months later. Bitcoin is at $81,810 (+11.1%) now, but the call was for the test, and the test came. Played out.
𝕏 Post“1D $BTC — below daily Cloud now, bottom of channel, active H&S breakdown” — @CarpeNoctom on X↗ x.com“4h $BTC poised for a Sun open attempt higher”
A short-term call on the 4-hour chart, posted at $78,677. Bitcoin pushed up: $81,437 (+3.5%) on 7 May and $82,018 (+4.2%) on 11 May, its high for the spring. The same evening he wrote that the drawdown recovery was the fastest ever “if the low holds”. It did not hold: by 1 July Bitcoin was at $58,566 (−25.6%). It is at $81,810 (+4.0%) now. The short-term call played out; the bigger move after it went the other way.
𝕏 Post“4h $BTC poised for a Sun open attempt higher” — @CarpeNoctom on X↗ x.com“Setup Sunday: Here's How $BTC Hits ATH in 2026”
The title of his weekly video, posted at $73,841, laying out a path to a new all-time high this year. The record is the October 2025 peak, above $120,000. Bitcoin first rose to $82,018 (+11.1%) on 11 May, then fell to $58,566 (−20.7%) on 1 July. It recovered to $86,597 (+17.3%) on 22 September and is at $81,810 (+10.8%) now. With ten weeks left in 2026, the record is still far away. Open.
𝕏 Post“Setup Sunday: Here's How $BTC Hits ATH in 2026” — @CarpeNoctom on X↗ x.comOutcomes are our read of the stated claim against real price, not his own scoring. Every quote is a verbatim X post, linked on its card and reproduced in full in the verified corpus. X's API writes the BTC and ETH token tags as “bitcoin:native” and “ethereum:native”, and we quote them as returned. We did not chart his weekly CoT and ETF-flow posts (data reports), hedged posts (“bull flag possible”), a 3 May post that was conditional on the low holding (it did not hold), or a later Puell Multiple post that restated the July bull case and would have scored as a win. From the 20 October refresh we also left out hedged or pattern-watch posts: “4h $BTC FW potential” (17 September), “1D $ETH unconfirmed hidden bull div” (8 October) and “$ETH H&S watch” (14 October), along with ratio charts such as SOL/BTC and ETH/BTC. Prices are CoinGecko daily marks, so an intraday post is measured from that day's mark. The 6 October card is graded from his own follow-ups, “looked*” the same day and “well, so much for that, on to the next trade” on 7 October, and from price. The “$1,000 in on his call” line assumes buying on the post date; for the bearish 29 May and 11 September cards, that line is not a short. Near-term marks can flip.
Olszewicz's posts and streams are free. His main income is his job, and his link page carries an exchange link. Here is what we found.
He is VP and Head of Trading at Canary Capital, which issues US crypto ETFs, including HBAR, Litecoin, Solana, SUI, TRX and XRP funds. It does not list a Bitcoin or Ether ETF. When he posts about the altcoins in those funds, keep in mind that his employer earns fees on them. On 19 September he posted “Time to buy some $SUIS ?”, which is the ticker of Canary's Staked SUI ETF.
The first link on his Linktree is Kraken Pro, routed through a tracked partner link (kraken.pxf.io). Links like this usually pay the referrer when someone signs up or trades. We did not find exchange referral pitches in his X posts.
The “Setup Sunday”, “Macro Monday” and “Broad Market Review” shows stream free on X, YouTube and Twitch. We found no paid newsletter, paid group or course.
“if channel support doesnt save this then we are probably headed for a 200WMA test”
29 May 2026 · the turn that played out“Heroes get remembered but bad calls never die”
3 Jun 2026 · reposting his 2018 miss“never seen Q3 this bullish”
30 Sep 2026 · on Bitcoin's July–September runQuotes transcribed from his own public sources; stated views, not recommendations.
Olszewicz streams on YouTube (@carpenoctom), on X and on Twitch, and posts each show to X. The Friday “Broad Market Review” covers crypto, macro and stocks. Recent streams we could verify:
 Broad Market Review: Drop It Like Its HotStreamed the day of his M top call.11 Sep 2026
 Broad Market Review: Breakout ConfirmedThe April Bitcoin breakout, three days before the all-time-high video.17 Apr 2026
 Broad Market Review - Home on the Choppy RangeBitcoin stuck in its range in early April.3 Apr 2026
A crypto trader and analyst who posts as @CarpeNoctom on X to about 149,000 followers. He is VP and Head of Trading at Canary Capital, and before that he was Head of Research at Valkyrie Investments and headed crypto research at BraveNewCoin. His method is Ichimoku cloud and classic chart patterns.
On our sample of eight dated 2026 posts: five played out, one is still open, two went against. His 29 May call for a 200-week moving average test came true within six days, and his 70k+ Bitcoin and August Ether breakout calls were hit. His 11 September M top call went against, as did a 6 October breakout setup that he dropped himself the next day. His April all-time-high title is still open.
A Japanese charting system that draws a shaded band, the “cloud” or kumo, from past highs and lows. Price above the cloud is read as an uptrend and price below it as a downtrend. Olszewicz uses breaks through the cloud as signals.
No paid product was found. His posts and streams are free. He is paid as head of trading at Canary Capital, and his Linktree carries a tracked Kraken Pro link.
Not publicly known, and no credible figure exists. Ignore any specific number you see attached to the name.
Olszewicz lets the cloud make the call. How close is your instinct? Measure it for real with a Trader Passport.
Now put your approach to work. Test your edge on live market data with no capital at risk in a free BuyCrypt tournament with real prizes.
Informational and educational analysis based strictly on publicly available materials: dated X posts captured from X's public endpoints and the sources linked on each call. Not financial or investment advice. Figures are approximate and change constantly. Spotted an error, or are you Josh? Submit a correction →
Verified handles · Sources cited above · Scoring methodology · Updated 20 October 2026

















