
@DonAlt
A pseudonymous technical trader who has posted the same way for nine years: a chart, three or four blunt lines, and a level that either holds or doesn't. He hedges out loud — “not bad, not great” is practically his catchphrase — and he says when he is sitting on his hands, which makes his record unusually easy to check.
In short. DonAlt (@DonAlt, formerly @CryptoDonAlt) is one of crypto's longest-running chart traders — on X since 2017, ~794K followers, and co-host of the weekly TechnicalRoundup show with CryptoCred. His method is deliberately narrow: horizontal support and resistance, weekly and monthly closes, and an explicit invalidation level on every idea. He trades majors (BTC, ETH) and is openly dismissive of most altcoins. The style's strength and weakness are the same thing — he will sit out for months waiting for a level, which saves him from bad entries and also costs him rallies. Both happened in 2026: his February patience kept him out of a rally of more than 30%, and his late-July and August posts caught the bottom almost exactly — after which he stayed long all the way to the September high.
DonAlt has been posting charts under a duck avatar since June 2017 and has never disclosed a real name, a fund, or a track-record spreadsheet. What he has instead is roughly 39,600 public posts and a weekly show, TechnicalRoundup (185K subscribers on YouTube, co-hosted with CryptoCred, new episodes every Friday), where the same charts get argued over live. Crypto press routinely introduces him by his 2024–25 XRP call — the run from roughly $0.50 to $3.66 — and by his warning near the November 2021 top. Those are real, but they sit outside this page's price window and are not scored here.
The posture that shows up in the record below is patience to the point of stubbornness. He states an invalidation level and a trigger, then does nothing until one of them prints. In February 2026 he wrote that he was waiting for either “a deeper discount ($42k)” or “a market structure shift (above $86k)” — the lower one never arrived, the upper one only on 22 September, at the top of the rally, and Bitcoin is +28.4% above where our price window now starts (9 March). In May he described himself as “preemptively bullish” eight days before the top of the spring rally, and BTC then fell 25.6%. He is also honest about the drag of that stance: on 5 June, near the lows, he wrote “Sentiment couldn't be worse, everyone is dying” and “Usually these are the times in which I'd get ready to buy a lot” — and then explained why he wasn't going to. BTC was $63,811 that day; it bottomed 26 days later and is +32.9% higher now.
The other half of the record is the half that worked. On 1 June he named the dip target and its limit in one sentence and the low came in 2.4% through it. On 29 July he turned constructive within 1.7% of the lowest close that followed. On 10 August he said Bitcoin would “teleport” past resistance; eleven days later it had. On 22 September, with BTC at what is still the highest close of the window, he wrote that it was “finally at the only resistance I deem serious enough to prevent a new ATH” — and that he was not taking profits. He is a level trader, not a forecaster — when the level is specific, he is good; when he is expressing a bias, he is no better than anyone else.
Sources: x.com/DonAlt · youtube.com/@TechnicalRoundup · dated press (Benzinga, U.Today)
Pure horizontal technical analysis, majors only. Support and resistance drawn on high timeframes, weekly and monthly closes as confirmation, and an explicit invalidation on every idea: above level X it looks good, below level Y he is out. He does not use targets as predictions; he uses levels as triggers, which is why he spends long stretches flat. He trades spot in the ideas he publishes and says so, is scathing about altcoins and about leverage in chop, and prefers admitting a chart is unreadable to inventing a thesis for it. The cost is opportunity: a trigger that never prints means a rally he does not take.
Openly bullish since August — long ETH, and declining to take profits on BTC at what he calls its last serious resistance — but still conditional on levels: he flips from “not bad, not great” to buying only when a close confirms, and he names the line that would make him wrong.
Fourteen dated calls from the last seven months, charted against real price. Thirteen are posts from his own X account, captured verbatim (text and timestamp pulled twice from independent endpoints); one is a dated podcast quote in Benzinga. His posts are levels and conditions, not price predictions, so we grade what price actually did against the condition he named. The pattern is stark and worth reading in order: the first three months are his worst stretch — waiting for prices that did not come in time — and late July to mid-August is his best, catching the bottom within 1.7%. From the end of August on he simply stayed long, and the calls since are mostly about not selling: an ETH post that drew a $2,000 line and said “I'll assume up”, a 22 September post that named the one resistance he respected — exactly where BTC has stalled since — and a 2 October “HODL”.
“I'm not in a rush so I'm waiting for a deeper discount ($42k) or a market structure shift (above $86k)”
23 February is now older than our 210-day price window, so this chart starts on 9 March, at $66,043. His lower trigger never fired: the worst close since is $58,566 (−11.3%), nowhere near his $42,000. His upper trigger fired exactly once — BTC closed at $86,597 on 22 Sep, the highest close in the window and +31.1% above where this chart starts. Read literally, the rule kept him flat through the whole rally and would have had him buying its top; BTC is $84,793 today, +28.4%. In fairness, he did not wait that long in practice — by late July he had turned constructive far below $86,000 (see the 29 Jul call).
𝕏 Post$BTC update: waiting for a deeper discount ($42k) or a market structure shift (above $86k) — @DonAlt↗ x.com“Decent reaction to support having been hit, resistance kinda meh from here on out”
Half right, half wrong, which is roughly what he claimed. The resistance half held for almost five months — from $76,332 BTC topped at $82,018 on 11 May and did not close above that again until 22 September. The support half did not hold — it broke first, and BTC lost −23.3% to $58,566. It has since reached $86,597 (+13.4%) and sits +11.1% above the day he posted. A genuinely non-committal call that we log as open rather than pretend was a signal.
𝕏 Post$BTC — Seems kind of alright to me. Not bad, not great — @DonAlt↗ x.com“I've been preemptively bullish but I think these are the levels at which sentiment and market behavior will shift notably”
He said this at $78,677 — eight days before $82,018 on 11 May, the top of the spring rally. His $70,000 “high likelihood of death” level fired in between, and BTC fell −25.6% to $58,566. His $87,000 acceleration level has still never closed — the high is $86,597, on 22 Sep — and BTC is +7.8% today, five months on. Credit where it is owed: the downside level he wrote down is the one that fired, and it worked exactly as described. The bias attached to it did not.
𝕏 Post$BTC — 78k$+ cautiously bullish · 87k$+ bullish acceleration · 70k$- high likelihood of death — @DonAlt↗ x.com“Could see us dip back into $60k support due to Saylor having found the sell button panic but would be surprised by more than that”
The best-specified call here, because it names the target and the limit in one sentence. From $73,599, BTC did dip into that zone — the low was $58,566 on 1 Jul, just 2.4% through the level he named — and it did not keep going. It has since run to $86,597 (+17.7%) and sits +15.2% above the day he posted.
𝕏 Post$BTC update: could dip back into $60k support, would be surprised by more than that — @DonAlt↗ x.com“Above the red line we actually look quite good”
Posted at $63,882, which turned out to be 1.7% above the lowest close that followed ($62,773). BTC then ran +35.6% to $86,597 and is +32.7% now. One stated limitation: “the red line” is a level drawn on his chart image, not a number in the text, so we grade the direction he flagged — constructive, willing to add — and not a numeric target.
𝕏 Post$BTC — Above the red line we actually look quite good — @DonAlt↗ x.com“Tiny push and this garbage resistance finally goes and we teleport to the next one”
It did. From $64,856 BTC dipped 3.1%, then broke out — to $86,597 by 22 Sep, +33.5% — and is +30.7% now. This post is where Benzinga's 24 Aug “Bitcoin Could ‘Teleport’ to $90,000” headline came from, so to be exact: $90,000 has not printed. The highest close since is $86,597 and BTC is $84,793 today.
𝕏 Post$BTC — This looks like it wants to explode — @DonAlt↗ x.com“middle of nowhere”
On a 12 Aug podcast he called Solana's chart the “middle of nowhere” — no clean invalidation, so no trade — and said he preferred Ethereum “not even close” when choosing between ETH, XRP and SOL, expecting ETH to outperform Solana longer term. He also said a SOL trade only becomes attractive on a reclaim of roughly $100, opening a move toward $120. SOL was $76: it reclaimed $100 on 27 Aug and closed above $120 on 26 Sep — a high of $122 (+60.2%) — and sits at $120, +57.9%. ETH over the same 53 days is +43.2%. So the SOL trade he described played out to the letter, and the relative call he actually made — ETH over SOL — is behind. Open, because he framed it long-term.
SourceBitcoin, Ethereum Will Outperform XRP, Solana in the Future — Benzinga / TradingView↗ tradingview.com“Bought some and will buy some more in the coming days”
A spot buy he flagged as uncomfortable — he was buying into resistance rather than waiting for a retest, after months of waiting for a deeper entry that never came. ETH was $1,878; the lowest close since is $1,874, so the entry cost him 0.2% of drawdown, and ETH has since run to $2,775 (+47.8%) and sits at $2,693, +43.4%. He said on the same show he had hoped for $1,700 and gave up waiting — the impatience was the right call.
𝕏 Post$ETH — Bought some and will buy some more in the coming days — @DonAlt↗ x.com“My official target is 4k”
Asked where he sells, he answered in three lines: official target $4,000, unofficial $10,000, and “I'll probably sell at 3k” — which is the number that actually matters, since it is what he says he'll do. ETH was $1,874 and is $2,693, +43.7%, with a high of $2,775. Still +11.4% short of the $3,000 he plans to sell into and +48.5% short of his stated target, so this one is open.
𝕏 PostMy official target is 4k / My inoffical target is 10k / I'll probably sell at 3k — @DonAlt↗ x.com“Cleanest chart in crypto right now”
Not a target — a description of the chart, plus a claim about what it would mean: “How ETH trades is probably gonna be indicative of the rest of the market.” ETH was $2,457. It held the range for three weeks — the low since is $2,391 (−2.7%) — then broke out on 19 Sep and closed at $2,775 (+12.9%) on 22 Sep, the same day BTC made its window high. It sits at $2,693, +9.6%. The post named no direction, so we held it open until the range broke; it broke the way he was positioned (long since 13 Aug) and the rest of the market went with it, so we now score it played out.
𝕏 Post$ETH — Cleanest chart in crypto right now — @DonAlt↗ x.com“Looks like we're gonna get another leg up soon”
It came, in two steps. BTC was $77,658; four days later it closed at $81,265, then slipped to $75,590 (−2.7%) on 16 Sep before running to $86,597 on 22 Sep (+11.5%), the highest close of this window. It is $84,793 today, +9.2% above where he posted.
𝕏 Post$BTC — Looks like we're gonna get another leg up soon — @DonAlt↗ x.com“No real resistance till $4k”
Two levels and a rule: “Real good support around $2.1k”, “if $2k fails it's probably gonna be a swift move down to $1k” — and “But as long as it hasn't failed, I'll assume up.” ETH was $2,467. The $2,000 line never came close: the lowest close since is $2,391 (−3.1%), two days later. ETH then rose to $2,775 (+12.5%) and is $2,693, +9.2%. The rule has worked so far; the “no real resistance” half has not been tested — ETH would still need +48.5% from here to reach $4,000. Open.
𝕏 Post$ETH — No real resistance till $4k · Real good support around $2.1k — @DonAlt↗ x.com“BTC is finally at the only resistance I deem serious enough to prevent a new ATH”
Posted at 00:33 UTC on 22 Sep, half an hour after the 00:00 UTC price our chart uses for that day — $86,597, which is still the highest close in this window. So the level he called serious is, so far, exactly where BTC stopped. What he did about it is the other half of the post: “Am I changing my positioning? No”, “Am I taking profits? No” — while conceding that bears “can at least make a compelling case” there. Since then BTC has dipped to $83,479 (−3.6%) and is $84,793, −2.1%. Open: right about the resistance so far, and positioned for it to break.
𝕏 PostBTC is finally at the only resistance I deem serious enough to prevent a new ATH — @DonAlt↗ x.com“No serious resistance left IMO”
His most recent call, and his plainest: “I'm just gonna ignore everything and HODL.” Posted at 04:46 UTC on 2 Oct; the price our chart uses for that day (00:00 UTC) is $2,705. Two days on, ETH has dipped to $2,668 (−1.4%) and is $2,693, −0.5% — far too early to score. The post gives no target and no invalidation; the nearest numbers he has put on ETH are “I'll probably sell at 3k” (17 Aug) and the $2,000 line he drew on 1 Sep.
𝕏 Post$ETH — No serious resistance left IMO · I'm just gonna ignore everything and HODL — @DonAlt↗ x.comOutcomes are our read of his stated condition against real price, not his own scoring. Every quote is verbatim and linked; nothing is paraphrased. Six calls are still open (two ETH targets, a long-term ETH-over-SOL preference, a non-committal April read, his 22 September resistance call and a 2 October HODL) and can still flip either way.
He sells no signals group, no course and no token — the thinnest monetisation of anyone in this database so far. What exists is an exchange affiliate link and a sponsored show, and both are worth knowing about.
His X bio carries a Kraken referral invite (verified 30 Aug 2026). Referral links pay per signup and per trading volume, which is an incentive to keep an audience trading — worth weighing against a style that is mostly about not trading.
WOO X announced a sponsorship of TechnicalRoundup plus “product ambassadorships” for DonAlt and CryptoCred in May 2023. No commercial terms were disclosed, and we could not confirm whether it is still active in 2026 — the announcement is three years old and his bio now points at Kraken instead.
On every page we fetched there is no paid signals group, no subscription, no course and no token. He publishes free and trades his own book — which he states is spot in the ideas above.
When he says he bought ETH at $1,878, he is talking about a position he holds. That is more honest than the alternative, and it is still a bias: he is long the thing he is describing.
“Tiny push and this garbage resistance finally goes and we teleport to the next one”
10 Aug 2026 · eleven days before the breakout“I'm not in a rush so I'm waiting for a deeper discount ($42k) or a market structure shift (above $86k)”
23 Feb 2026 · the patience that kept him out of the rally“Could see us dip back into $60k support due to Saylor having found the sell button panic but would be surprised by more than that”
01 Jun 2026 · the dip and its limit, in one sentenceQuotes transcribed from his own public sources; stated views, not recommendations.
TechnicalRoundup is his weekly show with CryptoCred — markets and levels, new episodes every Friday. Upload dates below are from the channel's own feed. (The older “Technical Analysis Series” tutorials that also carry the TechnicalRoundup name are CryptoCred's work, not his, so they are not listed here.)
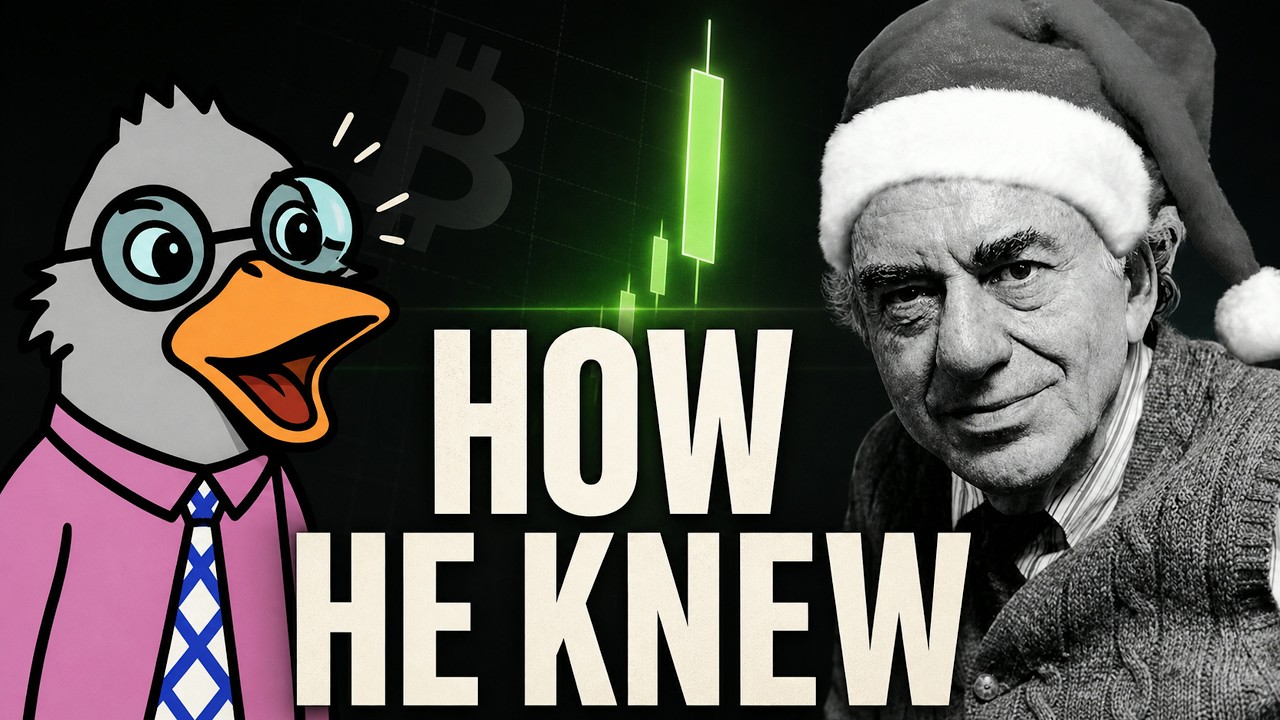 Bitcoin Teleported. What Do You Do Now?The show version of the 10 Aug “teleport” call, after it played out.21 Aug 2026
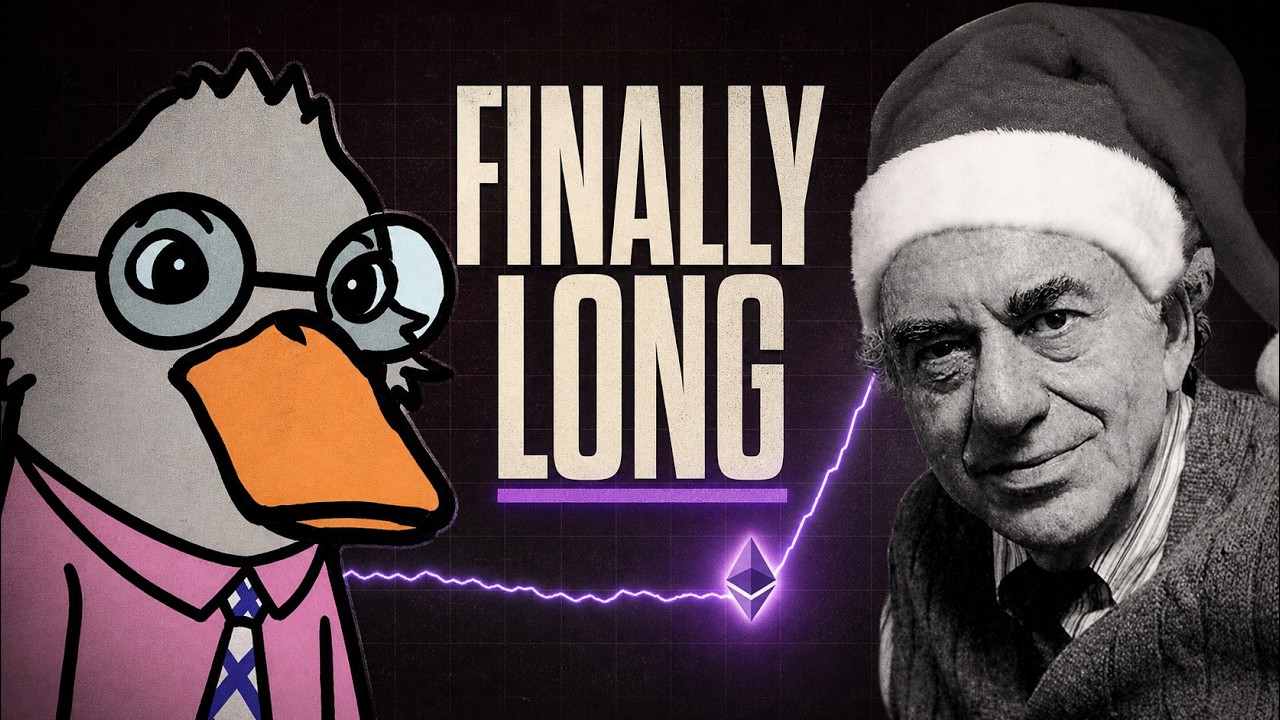 DonAlt Bought ETH (and Thinks It Can Go Back to $4K)Where the $1,878 ETH buy and the $4,000 target were laid out.15 Aug 2026
 The First BTC Pullback Hasn't Broken AnythingHis read on the first real pullback since the August breakout.28 Aug 2026
 A Decade of Trading Mistakes in One EpisodeTen years of his own errors, catalogued — unusually useful.08 Aug 2026
 Bitcoin Finally Closed the Month at Support (Now the Clock Is Ticking)Four days after the $58,566 low, working through the monthly close.05 Jul 2026
A pseudonymous crypto technical trader, on X since June 2017 as @CryptoDonAlt and now as @DonAlt with roughly 794,000 followers. He co-hosts the weekly TechnicalRoundup show with CryptoCred (185K subscribers on YouTube). His real name, nationality and any fund affiliation have never been made public.
Yes — crypto press consistently credits him with calling XRP's run from roughly $0.50 to $3.66 in 2024–25, and it is why headlines still introduce him as the “Author of Legendary 700% XRP Prediction.” It is also outside the price window this page charts, so it is not scored here. Everything in the track record above is from the last seven months.
Not publicly known and not estimable. He is pseudonymous, publishes no portfolio, sells no product, and has never disclosed size. Treat any specific figure you see as invented.
He is a pseudonymous commentator, not a licensed adviser. His 2026 record is genuinely mixed: two calls went against him — including describing himself as bullish eight days before the May top — and six played out, including catching the July–August bottom within 1.7%. He states an invalidation level on almost every idea, which makes him easy to check. Never trade someone else's levels blindly.
Horizontal support and resistance on high timeframes, confirmed by weekly and monthly closes, with an explicit invalidation on every idea. He trades majors — mostly Bitcoin and Ethereum — spot rather than leveraged in the positions he publishes, is dismissive of altcoins, and will sit flat for months waiting for a level to trigger.
DonAlt waits for a level and does nothing until it prints — even when that costs him a rally. How close is your instinct? Measure it for real with a Trader Passport.
Now put your approach to work. Test your edge on live market data — no capital at risk — in a free BuyCrypt tournament with real prizes.
Informational and educational analysis based strictly on publicly available materials — his own dated X posts and dated third-party coverage, linked on every call. Not financial or investment advice. Figures are approximate and change constantly. Spotted an error, or are you DonAlt? Submit a correction →
Verified handles · Sources cited above · Scoring methodology · Updated 4 October 2026

















