
@alicharts
The analyst behind half the “analyst says Bitcoin could fall to…” headlines you have read this year. Ali Martinez turns on-chain valuation models into exact dollar levels, posts them dated and in public, and gets quoted everywhere. This page charts thirteen of those levels against what price actually did — and the pattern is sharper than either his fans or his critics would guess.
In short. Ali Martinez posts as @alicharts and is one of the most-quoted level-callers in crypto media: MVRV pricing bands, the Bitcoin Investor Price, Delta Price, the Coinbase Premium Index, all converted into a specific number you could put an order at. Across the last seven months two things are true at once. When he reads a floor that has already formed, he is very good — his 2 July “high-value price floor” post landed one day after Bitcoin's low and BTC never closed lower. When he names a deeper level price should still fall to, he is consistently too low — five separate posts in this window pointed at $54,270, $53,900, $43,130, $48,300, $60,000 and (per TheStreet) $54,276, and Bitcoin never traded at any of them afterwards. Great at spotting the bottom; bad at guessing how far down it is. Since mid-September the tone has flipped to breakout targets — Solana $130, Ethereum $2,760, Bitcoin $100,000 — and the nearest of them, $2,760, printed in two days.
Ali Martinez works the crypto-media beat from both sides. He has a writer's by-line — CryptoSlate still runs his author page, whose bio says he came across Bitcoin's whitepaper in 2014 and started accumulating BTC from there — and he is also the analyst those newsrooms quote. Under the handle @alicharts (“Ali Charts”, on X since May 2018, ~166K followers) he publishes a near-daily stream of on-chain charts with a hard number attached, which is exactly the raw material a markets desk needs. TheStreet, Benzinga, Finbold, NewsBTC and Coinpedia have all run his levels as news inside this window alone.
His toolkit is on-chain valuation rather than classical chart patterns: the MVRV Ratio and MVRV pricing bands, the Bitcoin Investor Price, Delta Price, the Coinbase Premium Index, URPD supply clusters, with TD Sequential and moving-average crosses layered on top. Two caveats belong on the record up front. First, his best-known 2026 calls — a $31,000 Bitcoin bottom and an October 2026 cycle low near $37,500 — were made in January with BTC around $88,300, before this price window opens, so they cannot be charted here and are not scored; they are noted because they are the same downside-heavy instinct the charted record shows. Second, the thirteen cards below are graded on what price did, not on whether the reasoning was elegant.
Sources: x.com/alicharts · linktr.ee/alicharts · youtube.com/@ali.charts · cryptoslate.com/author/ali-martinez · dated coverage from TheStreet/Yahoo Finance, Benzinga/TradingView, Finbold and Bloomingbit
On-chain valuation, converted into a price you can act on. Martinez rarely argues narrative. He takes a cost-basis model — MVRV bands, Investor Price, Delta Price — reads off the level where that model says value sits, and publishes it as a number: “$48,300”, “$63,800”, “$94,850”, “$700”. That is a genuine service; almost nobody else in crypto media is that specific that often, and it makes him unusually easy to score. The weakness is structural and shows up clearly over thirteen calls: the models he favours mark deep-capitulation zones, so his named levels sit far below spot, and in a market that corrected hard but not catastrophically they simply never got filled. He is also comfortable holding both sides at once — on 2 July he called the floor found at 06:04 and told people to buy at $48,300 at 09:56 — which reads as intellectual honesty on the timeline and as a coin-flip to anyone trying to trade him.
Long-term constructive, short-term persistently defensive. He is a buyer in theory — but the prices he wants to buy at sit so far below the market that in this window the posture played out as bearish, and the market went the other way.
Thirteen dated posts from @alicharts, each pulled from X twice and byte-matched before it was scored, then charted against real CoinGecko prices. Read the scorecard with the split in mind: the five that worked are all cases where he identified a floor already in place or a breakout already starting; the four that failed are all cases where he named a lower price Bitcoin or Ethereum would still fall to. Across the whole window he pointed at $54,270, $53,900, $43,130, $48,300, $60,000 and $54,276 as places price was headed — and after each was named, not one of them ever printed. Bitcoin's actual low here was $58,566 on 1 July 2026.
“Ethereum $ETH has entered a generational "Buy Zone." … On-chain data suggests Ethereum is approaching a long-term bottom. For those with a 12-24 month horizon, the accumulation window is officially open!”
He put a 12–24 month horizon on this himself, so it is not due yet and we log it open. What has happened since: ETH was $2.2k ($2,203) that day, fell −29% to $1.6k ($1,566) on 26 Jun, then ran +26.0% above his entry to $2.8k ($2,775) on 22 Sep and holds $2.7k ($2,714), +23.2%. The MVRV zone he pointed at was real — but “generational” bought you a 29% drawdown before anything else.
𝕏 PostEthereum $ETH has entered a generational “Buy Zone.” — @alicharts↗ x.com“Based on the MVRV pricing bands, Bitcoin $BTC has a chance of rallying toward $94,850 as long as it holds above $72,960. Losing this level could put Bitcoin at risk of a deeper correction toward the realized price around $54,270.”
Neither target printed, but the line did its job. BTC lost $72,960 on 2 Jun (closing $71.3k) and then fell to $58.6k ($58,566) on 1 Jul — 20% below the level he drew, and −24% from the day he posted. The “deeper correction” he warned about is exactly what followed, so we score the branch that actually triggered. Being straight about the misses: his $54,270 never came (BTC stopped ~8% above it) and the $94,850 upside never came either — the high since is $86.6k ($86,597).
𝕏 PostMVRV pricing bands: $94,850 as long as it holds $72,960 — @alicharts↗ x.com“One metric has nailed Ethereum $ETH last two market bottoms: Delta Price by @Alphractal. Today, it sits near $700. … If history rhymes, Ethereum could revisit $700 before the next sustained uptrend.”
Ethereum never went near it. From $1.6k ($1,639) the day he posted, the lowest close since was $1.6k ($1,566) on 26 Jun — still 124% above his $700 — and ETH then ran +69.3% to $2.8k ($2,775) on 22 Sep and holds $2.7k ($2,714), +65.6%. Credit where it is due: he did not stay married to it. Five weeks later he published “I'm going LONG on Ethereum as it breaks $1,850” (16 Jul, ETH $1,917).
𝕏 PostDelta Price sits near $700 — Ethereum could revisit it — @alicharts↗ x.com“When small fish and whales buy at the exact same time, it historically indicates that the market has found a high-value price floor.”
His best call of the window. He posted this at $60.0k ($59,968) — one day after Bitcoin's window low of $58.6k ($58,566) on 1 Jul — and BTC has never closed lower since. It ran +44.4% to $86.6k ($86,597) on 22 Sep and holds $85.2k ($85,208), +42.1%, with a worst dip along the way of 0%. A wallet-cohort read that landed within a day of the actual bottom.
𝕏 PostIS IT TIME TO BUY BITCOIN? — small fish and whales buying together — @alicharts↗ x.com“BUY BITCOIN AT $48,300 — This level is defined by the Bitcoin Investor Price, one of the most accurate models for tracking the market's true cost basis. … If the current market correction deepens and pushes $BTC toward the $48,300 territory, it should be treated as the primary signal that the macro bottom is locked in and the risk-to-reward ratio for a long-term position is heavily optimized.”
Posted three hours and 52 minutes after the floor call above, on the same morning, pointing the other way. Bitcoin never came within a quarter of it: the lowest close after was $60.0k ($59,968) — the day itself, +24% above his level — and BTC rallied +44.4% to $86.6k ($86,597). The body is conditional (“if the current market correction deepens”), but the headline is an instruction in capitals, and anyone who waited for it is still waiting.
𝕏 PostBUY BITCOIN AT $48,300 — the Bitcoin Investor Price — @alicharts↗ x.com“Keep an eye on Bitcoin $BTC at $63,800. If this level holds as support, I'm watching for a rebound toward $67,000. But if it breaks, the next downside target sits around $60,000.”
A clean two-sided setup that resolved into neither branch. The level broke — BTC closed $63.7k ($63,701) on 28 Jul and bottomed at $62.8k ($62,773) on 2 Aug, 2% below his line — so the bearish branch triggered, and then the $60,000 downside target never printed. Instead BTC turned and ran +35.1% to $86.6k ($86,597). His $67,000 was cleared on 20 Aug at $69.3k ($69,291), but only after the structure he described had already failed.
𝕏 PostKeep an eye on Bitcoin at $63,800 — @alicharts↗ x.com“SOLANA BREAKOUT. TARGET $100.”
This one simply worked. SOL was $75.96; it cleared the $78 mid-channel level on 20 Aug ($85.33) and closed above his target at $102 on 27 Aug — 18 days. It then ran +60.7% to $122 ($122.08) on 26 Sep and holds $120 ($119.95), +57.9%; the worst dip in between was −2%. Disclosure: the verified post is the opening line of a five-part thread; the $78 mid-channel detail comes from Benzinga's write-up of that thread, not from this quoted line.
𝕏 PostSOLANA BREAKOUT. TARGET $100. — @alicharts↗ x.com“WARNING: BITCOIN SELLING PRESSURE IS SURGING”
The warning marked the bottom. BTC closed $64.5k ($64,491) that day and that is the lowest close since — it ran +34.3% to $86.6k ($86,597) on 22 Sep and holds $85.2k ($85,208), +32.1%. TheStreet, reporting the same eight-part thread that day, put his support zone at $63,111–$61,849 and his downside target at $54,276; neither was touched. This card quotes only the verified opening post — the thread's later parts could not be captured from the API, so the $54,276 figure is TheStreet's reading of it, not his quoted words.
𝕏 PostWARNING: BITCOIN SELLING PRESSURE IS SURGING — @alicharts↗ x.com“Stop being bearish on Solana $SOL. … The setup is turning bullish, and I think it's time to lock in before the next major move. Here's why.”
Directional rather than level-based — and the direction was right. SOL closed $103 ($103.01) the day he posted, four days after a $109 ($109.18) close on 28 Aug, so “stop being bearish” came after one leg up, not before it. SOL dipped to $96.87 on 16 Sep (−6.0%), then ran +18.5% to $122 ($122.08) on 26 Sep and holds $120 ($119.95), +16.4%, so we now score the call he actually made as played out. Disclosure: the $150 target and the $103 cost-basis support that the press hung on this post come from CoinGape's and The Coin Republic's write-ups of the thread, not from the quoted line. That support broke on 16 Sep, and the $150 has not printed — it is +25.0% from today's price, and he was still “watching for the next leg higher toward $150” on 29 Sep.
𝕏 PostStop being bearish on Solana $SOL — the setup is turning bullish — @alicharts↗ x.com“ETHEREUM TARGETS $3,000 … The last triangle breakout sent Ethereum surging 31% in just three days. Now, another triangle is forming. If $ETH breaks out again, a similar move could send it to $3,000.”
Still open — the $3,000 has not printed. Worth marking where it was posted from: ETH closed $2,525 on 13 Sep, at the time the highest close of the window, so the target call came at the top of the range, not into weakness. ETH then dipped to $2,397 on 16 Sep (−5.1%), ran +9.9% to $2,775 on 22 Sep and holds $2,714, +7.5%. His $3,000 is +10.5% from here. His own scorecard agrees it is unfinished: on 22 Sep he posted a check mark next to $2,700 and an hourglass next to $3,000.
𝕏 PostETHEREUM TARGETS $3,000 — another triangle is forming — @alicharts↗ x.com“SOLANA BREAKOUT IS NEAR … The key level I’m watching for $SOL is $105. A sustained close above it could confirm the bullish breakout and open the door to a rally toward $130.”
Half done. SOL closed $98.54 the day he posted; it cleared his $105 trigger two days later ($112.70 on 19 Sep), ran +23.9% to $122 ($122.08) on 26 Sep and holds $120 ($119.95), +21.7%. The breakout he flagged was real; the $130 target has not printed and is +8.4% from here, so we keep it open.
𝕏 PostSOLANA BREAKOUT IS NEAR — $105 trigger, $130 target — @alicharts↗ x.com“ETHEREUM BREAKOUT CONFIRMED … $ETH broke above $2,560, successfully retested it as support, and is now pushing higher. With the breakout holding, I’m watching $2,760 as the next major target.”
A short-range target that landed. ETH closed $2,632 the day he posted and $2,775 on 22 Sep — above his $2,760, +5.4%, in two days. That evening he posted a check mark next to $2,700 and an hourglass next to $3,000. ETH holds $2,714 today, +3.1%. A modest move, called after the breakout had already started — but the number he named printed.
𝕏 PostETHEREUM BREAKOUT CONFIRMED — next target $2,760 — @alicharts↗ x.com“The MVRV Pricing Bands tell a similar story: the mean band near $100,670 is the next key resistance for $BTC, while the -0.5 band near $74,361 acts as major support. As long as demand remains strong, $100,000 is in focus.”
Open, and not close yet. He posted this on the day BTC closed $86.6k ($86,597) — its highest close since March — so, like his 13 Sep Ethereum target, the bullish call came at the top of the move. BTC has since dipped to $83.5k ($83,479) on 29 Sep (−3.6%) and holds $85.2k ($85,208), −1.6%. His $100,000 is +17.4% from here; the $74,361 support band he named sits 12.7% below today's price and has not been tested. This is part 5 of a six-post thread that opens “BITCOIN KEEPS SURGING. TARGET: $100,000”.
𝕏 PostBITCOIN KEEPS SURGING. TARGET: $100,000 — MVRV mean band near $100,670 — @alicharts↗ x.comOutcomes are our read of his stated claim against real price, not his own scoring. Quotes are verbatim from the linked X posts; where a card cites a level that came from press coverage of a thread rather than the quoted line, the card says so. The 19 March Ethereum call is explicitly a 12–24 month idea and is logged open, not failed.
Martinez does not sell a token or run a fund, and his X output is free. The money sits one click away, on his own link page — and one of those links pays him when you sign up to trade.
His Linktree's first link goes to whop.com/alicharts, a subscription community. Its own description reads: “I'm a full-time trader sharing the exact setups I use to trade crypto and stock futures. Real entries, exits, and strategy.” Pricing and member counts are rendered client-side and could not be read from the raw page, so no figure is quoted here — but understand that the free levels feed a paid product.
The second Linktree link, labelled Copy Trading, is partner.blofin.com/d/AliCharts — a partner referral URL, meaning sign-ups and the trading volume that follows can pay the referrer. Any public call that moves readers toward opening an account sits next to that incentive.
He is a crypto-media writer — CryptoSlate still hosts his author page — and the analyst that TheStreet, Benzinga and Finbold quote. Nothing improper about it, but “analyst says Bitcoin could crash to $X” headlines are cheap to generate, and he is a newsroom professional who knows precisely what makes one.
“When small fish and whales buy at the exact same time, it historically indicates that the market has found a high-value price floor.”
02 Jul 2026 · his best read — one day after the low“BUY BITCOIN AT $48,300”
02 Jul 2026 · posted the same morning; never filled, BTC ran +44%“SOLANA BREAKOUT. TARGET $100.”
09 Aug 2026 · the target he actually hit, in 18 daysQuotes transcribed from his own public sources; stated views, not recommendations.
Alongside X he posts short chart videos to youtube.com/@ali.charts — the same levels, spoken. Recent uploads:
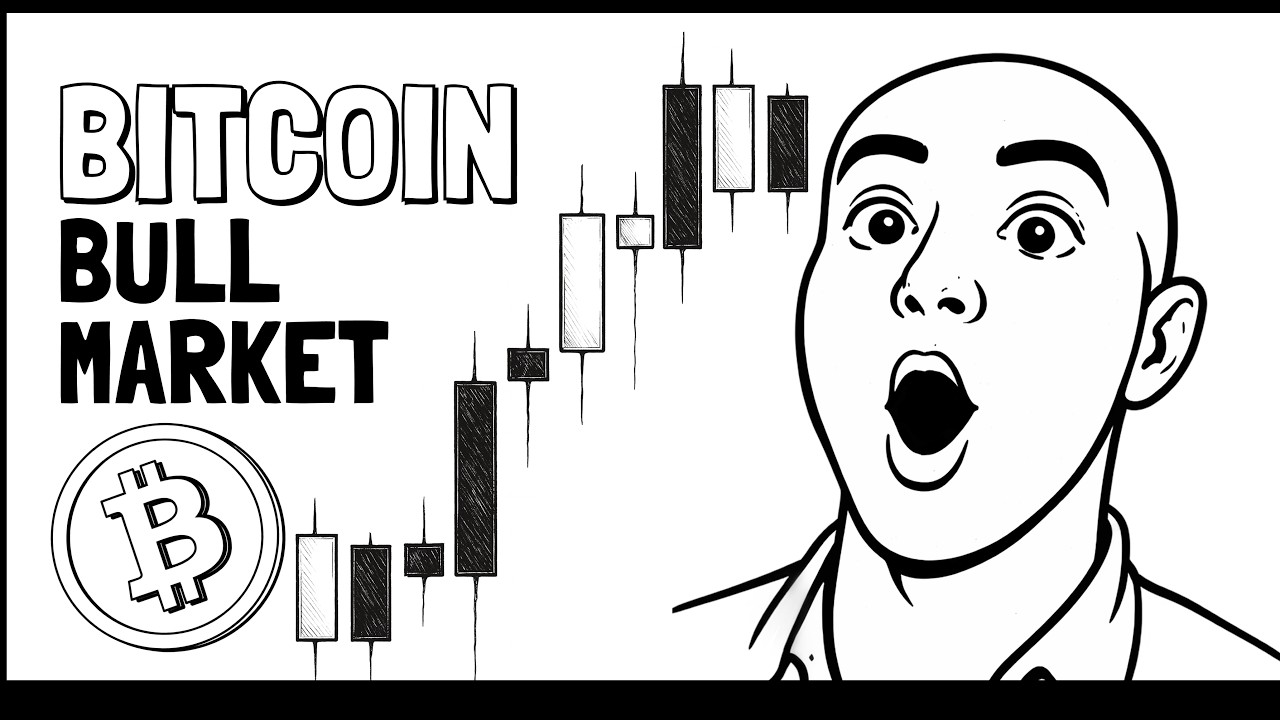 3 reasons why Bitcoin started a new bull market.The bullish flip, a week before the 18 August selling-pressure warning.11 Aug 2026
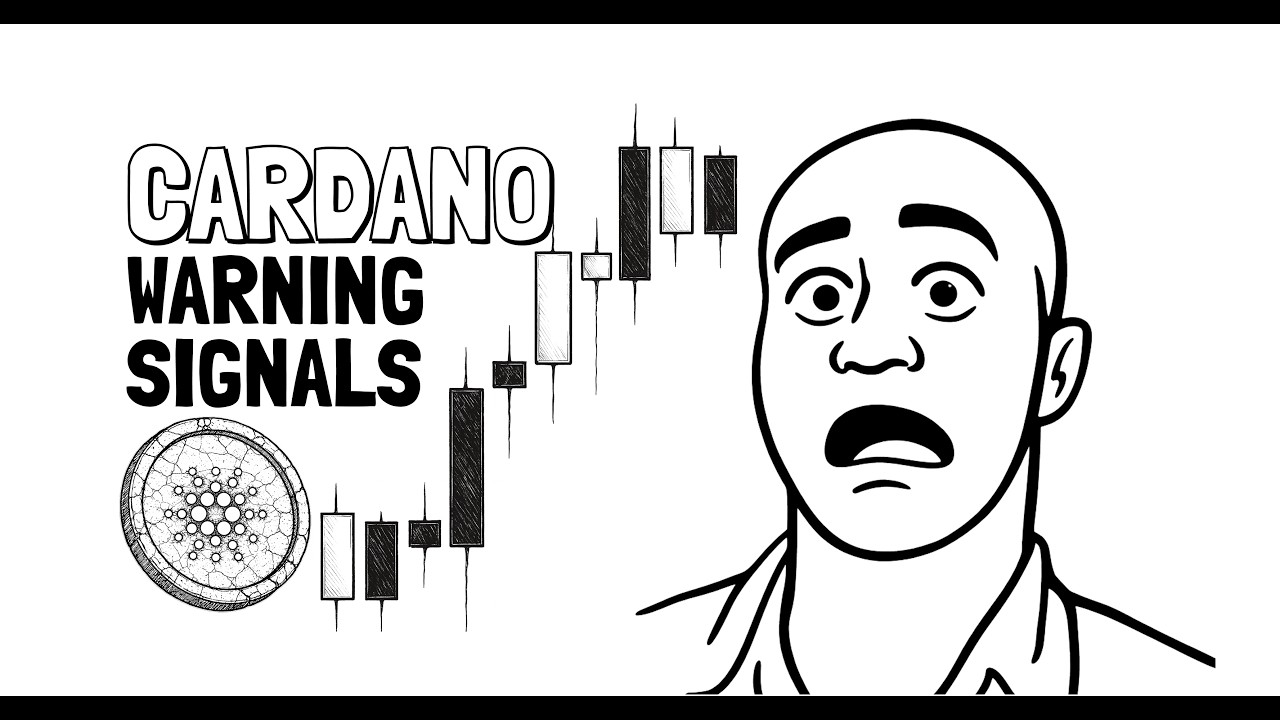 3 Warning Signals for CardanoSame model stack applied outside the four assets charted here.12 Aug 2026
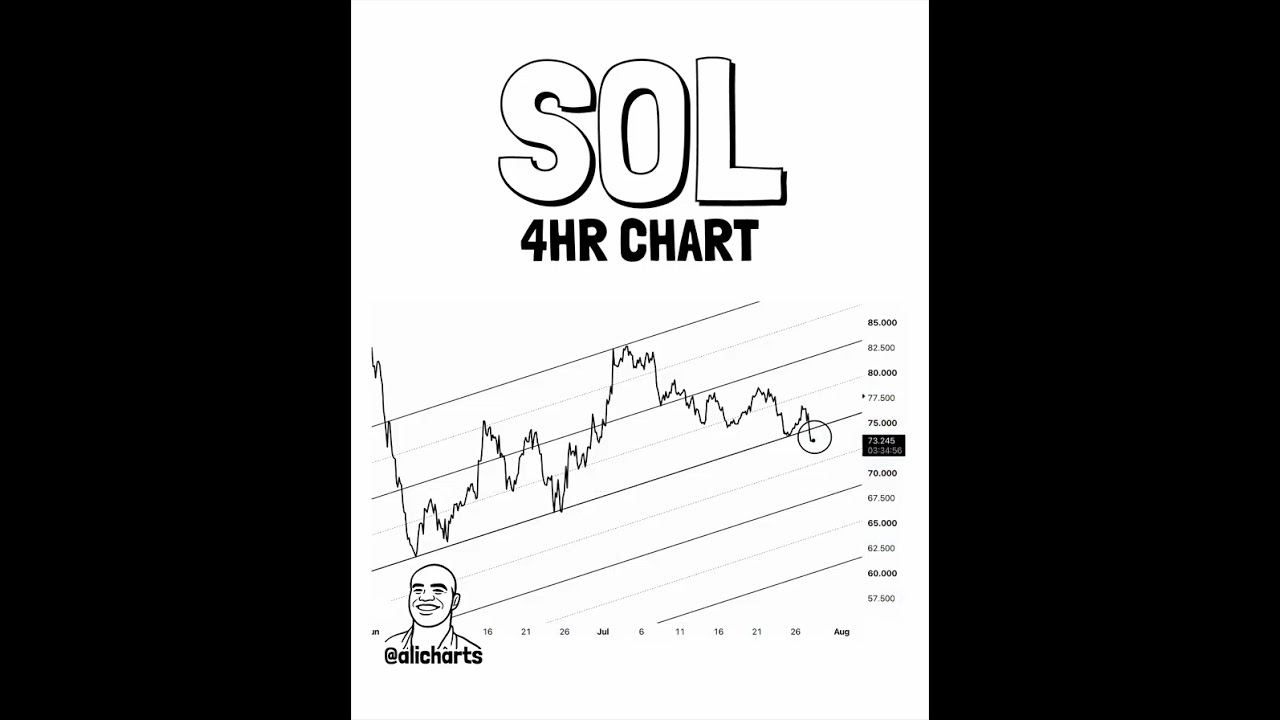 Solana $SOL just lost its rising channel.The channel work that became the 9 August $100 breakout call.28 Jul 2026
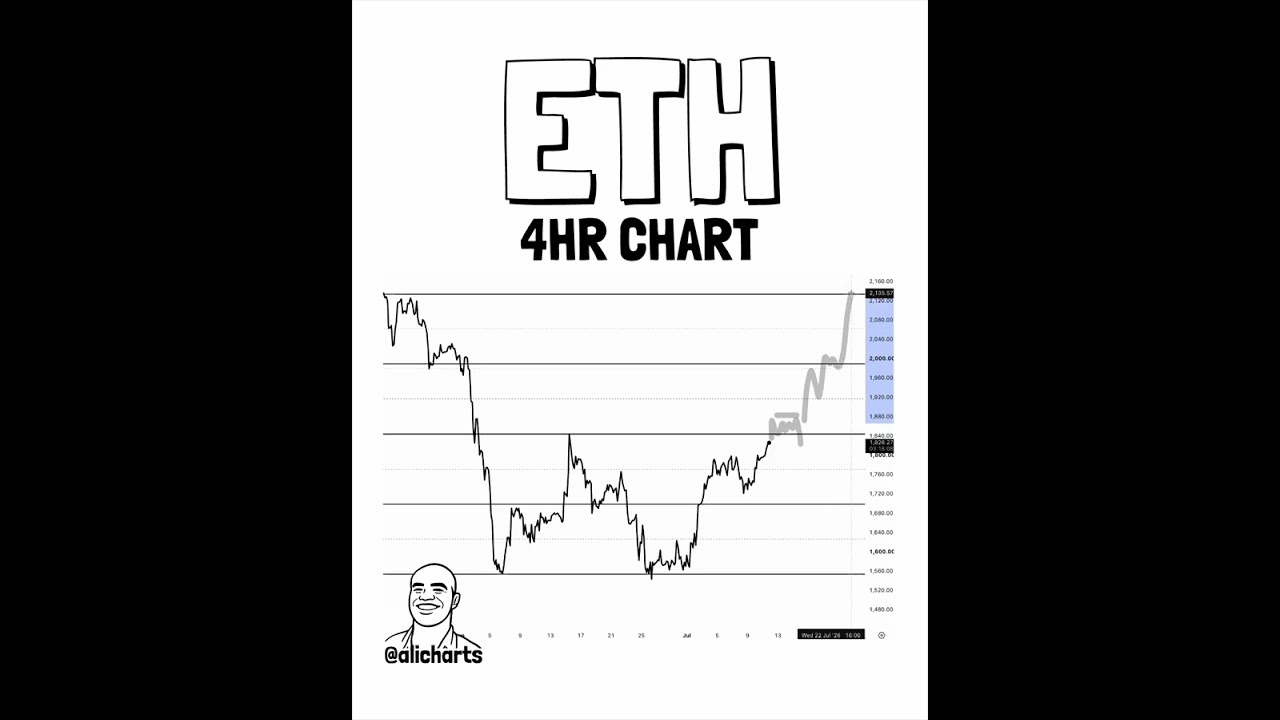 I'm going LONG on Ethereum as it breaks $1,850.Five weeks after saying ETH could revisit $700 — he changed his mind out loud.16 Jul 2026
A crypto analyst and trader who posts as @alicharts (“Ali Charts”) on X, where he has roughly 166,000 followers. He also writes for crypto media — CryptoSlate hosts his author page — and is one of the analysts most frequently quoted by TheStreet, Benzinga, Finbold and NewsBTC for specific Bitcoin price levels.
Mixed, and the split is very consistent. Of the thirteen dated calls charted here, five played out, four are still open and four went against. He is strong at recognising a floor that has already formed — his 2 July 2026 post landed one day after Bitcoin's low — and weak at predicting how much further price will fall: the six deeper levels he named in this window ($54,270, $53,900, $43,130, $48,300, $60,000 and $54,276) were never reached after he named them.
Not publicly known and not verifiable. He describes himself as a full-time trader and runs a paid community, but no audited figure exists. Treat any specific number you see as invented.
On-chain valuation converted into exact price levels. He works from the MVRV Ratio and MVRV pricing bands, the Bitcoin Investor Price, Delta Price, the Coinbase Premium Index and URPD supply clusters, then publishes a specific number to buy or watch — often with an explicit “if it holds / if it breaks” pair.
Martinez turns a model into one exact number and posts it. How close is your instinct to his — and does naming a level actually help you? Measure it for real with a Trader Passport.
One of those ran 44% and the other never filled. Find out which instinct is really yours — trade live market data with no capital at risk in a free BuyCrypt tournament with real prizes.
Informational and educational analysis based strictly on publicly available materials — dated posts from his own X account, each verified against two independent endpoints before scoring, plus dated third-party coverage linked on the cards. Not financial or investment advice. Figures are approximate and change constantly. Spotted an error, or are you Ali? Submit a correction →
Verified handles · Sources cited above · Scoring methodology · Updated 2 October 2026

















