
@willywoo
The analyst who made “on-chain” a category. Woo doesn't read candles — he reads where money actually moves: investor flows, realised prices, the cost basis of recent buyers. Through most of 2026 that model kept him bearish while the rest of crypto looked for a bottom, and the price mostly agreed with him. Where it didn't, it didn't by a wide margin — his 46k–54k bottom zone never printed. In September, with long-term liquidity returning, he turned: on 16 September he put 90% odds on the bottom being in.
W skrócie. Willy Woo is one of the original Bitcoin on-chain analysts — creator of the NVT ratio (“Bitcoin's P/E”), publisher of the Woobull chart library, and author of the weekly Bitcoin Vector Lite letter on Substack. His framework is deliberately not technical analysis: he models investor liquidity flows and compares price against on-chain cost bases (short-term-holder price, realised price, the CVDD floor) to say where the market is in its cycle. For most of 2026 that model made him one of the most consistently bearish major voices — and, for the levels that mattered, largely right: he called the March rally a bull trap and it was rejected exactly where he said. He is also on record with targets that never arrived, from $250k in 2021 to a 46k–54k bottom this year — a zone he effectively retired in September, when he called the bottom in at 90% odds.
Woo trafił na rynki z oprogramowania — publikowane profile opisują programistę urodzonego w Hongkongu i wychowanego w Nowej Zelandii, który budował i sprzedawał startupy, zanim przeszedł do tradingu, i który kupił swojego pierwszego bitcoina pod koniec 2013 roku. Nazwisko zrobiła mu nie transakcja, lecz wskaźnik: w 2017 roku spopularyzował NVT, czyli wartość sieci podzieloną przez wolumen transakcji, przedstawioną jako „Bitcoin's P/E ratio”. Stał się pierwszym szeroko używanym narzędziem wyceny on-chain, a biblioteka wykresów Woobull, która wokół niego wyrosła, do dziś jest standardowym punktem odniesienia. Dziś publikuje co tydzień Bitcoin Vector Lite na Substacku — „views into BTC's underlying structure through the lens of investor flows” — z płatnym poziomem za nim.
The record cuts both ways and the misses are large. On 29 April 2021 he told SALT Talks that Bitcoin “could reach $250K to $300K by the end of that cycle”, later stretching it to $300K–$400K on institutional inflows; Bitcoin topped near $69,000 that November. In September 2025, with BTC just off a $124,457 record, he suggested it “could race up to $140,000–$160,000” — while adding he couldn't tell. It never did. And on 11 January 2026 he posted “I'm bullish BTC late Jan through Feb but presently bearish for 2026”: the bearish half aged well, the bullish half did not — Bitcoin fell from $89,212 on 29 January to $67,017 by 1 March, −25% straight through the window he was bullish on. That January post sits just outside the chart below; the seven calls that follow are all inside it.
Sources: x.com/willywoo (verified via X syndication) · woobull.com · willywoo.substack.com · Bitcoin.com News · Yahoo Finance
Najpierw przepływy, potem cena. Jednostką analizy Woo jest kapitał, a nie świeca: ile realnych pieniędzy wchodzi do Bitcoina lub z niego wychodzi i jak to się ma do momentum ceny, które te pieniądze mają wspierać. Powracające narzędzia to on-chainowe koszty bazowe — cena krótkoterminowych posiadaczy (próg rentowności kupujących z ostatnich 155 dni), cena zrealizowana oraz podłoga CVDD — plus jego własne modele przepływów inwestorów i spojrzenie na ryzyko międzyrynkowe (zmienność akcji, płynność makro). To daje mu strukturę i cierpliwość: potrafi powiedzieć „Still weeks more in this mid bear consolidation” i naprawdę tak myśleć. Słabość jest symetryczna. Modele przepływów są dobre w określaniu reżimu (bessa czy hossa) i słabe w skali — jego kierunkowe wezwania trzymały się o wiele lepiej niż konkretne liczby przy nich.
Bearish on 2026 from January through the summer — his flow models had liquidity waning against price since January 2025. September is where that changed. On 6 September 2026 he flagged Bitcoin decoupling from equities as it did in 2015, and on 16 September he put the probability that the bottom is in at 90%, calling the market an early bull structure on returning long-term investor liquidity. His longer view is unchanged: Bitcoin in seven figures, but over a 12–16 year horizon.
Seven dated 2026 posts, charted against real price from the day he said them. Every quote below was pulled from X's own syndication endpoint or from the dated article that carries it — nothing is paraphrased. Woo trades in regimes and levels rather than one-line targets, so each card scores the specific claim he made: did the rejection happen where he said, did the level break, did the bottom print in the zone. He was right on the shape of the market in Feb–April and wrong on how deep it would go; the two newest cards, from September, are the first in this window pointing up — ending with his call that the bottom is in.
“This bearish sell down by investors seems to have exhausted, which gives price a repreive to consolidate sideways for maybe a month, even a rebound to mid 70s, which would likely to be rejected.”
A three-part call, and all three parts happened. His 27 February post has since rolled out of our 210-day price window, so the chart now anchors at the first covered close, $65,824 on 2 March, and the percentages here run from there. Bitcoin consolidated sideways for roughly a month, rebounded into the mid-70s — $74,679 on 17 March, +13.5% — and was rejected there, back to $65,947 (+0.2%) by 30 March. It later fell as far as $58,566 (−11.0%), then ran +31.6% to $86,597 on 22 September and holds $84,359 (+28.2%). The typo in “repreive” is his; we quote posts as written.
𝕏 Post@willywoo on X — 27 February 2026↗ x.com“BTC sold off WAY TOO FAST in this early bear market and current conditions are setting up to test mid-80s which is the cost basis of short term investors.”
Resolved — on his terms, but late. The framing was right: he said the rally was a bull trap and “NOT me saying the bottom is in”, and from $67,340 BTC rallied, rolled over and cut to $58,566 (−13.0%) on 1 July. The target took far longer than the setup implied. The May rally stalled at $82,018 (+21.8%), and the mid-80s short-term-holder cost basis he named was only tested on 22 September, at $86,597 (+28.6%) — six and a half months after the post, with a deeper low in between. Both halves have now happened, so we move this card from open to played out; price holds $84,359 (+25.3%).
Source‘Bull Trap Forming’ — Willy Woo Says Bottom Not In for Bitcoin (Bitcoin.com News, 9 Mar 2026)↗ news.bitcoin.com“I’d agree with this picture with the rejection at STH price which is 84k and dropping each day. Still weeks more in this mid bear consolidation.”
He named the level and the duration. BTC was $71,304; it was rejected immediately, down to $65,947 (−7.5%) in four days, and the “mid bear consolidation” ran for months rather than weeks. Through that whole stretch it never reached the 84k short-term-holder line he flagged as the ceiling — the summer high was $82,018 (+15.0%) on 11 May — before sliding to $58,566 (−17.9%) on 1 July. Bitcoin only closed above 84k on 22 September, six months later; it ran +21.4% to $86,597 and holds $84,359 (+18.3%). The call was about the spring, and on that horizon the level held.
𝕏 Post@willywoo on X — 26 March 2026↗ x.com“Old school onchain models suggest a BTC bottom between 46k-54k. Also hints at how much time we have to wait.”
His most specific number, and the one that has gone wrong. From $65,947 he was pointing 18–30% lower, with the CVDD floor model at 45.5k. Bitcoin never got there. The deepest close since is $58,566 on 1 July, −11.2% from his post and 8.5% above the top of his zone — and price has since run +31.3% to $86,597 and holds $84,359 (+27.9%). A fresh leg down could still validate it, but on 16 September Woo himself put 90% odds on the bottom already being in (last card below), which leaves this zone with few defenders.
𝕏 Post@willywoo on X — 30 March 2026↗ x.com“The next test for BTC is cleanly breaking the cost basis of recent investors (79k). I give it 30% odds on doing this on this attempt.”
A conditional call, and the condition failed the way he warned it might. BTC was $77,367. It did break 79k — the 30% branch — peaking at $82,018 (+6.0%) on 11 May. But he had added that a structural bottom only becomes likely “if BTC manages to hold this price level above $65K and not break down”, and that “the next 3-6 weeks will be telling”. It broke down: nine weeks later Bitcoin closed at $58,566, −24.3%. No structural bottom in that window, exactly as he framed it. Price has since run +11.9% to $86,597 and holds $84,359 (+9.0%).
𝕏 Post@willywoo on X — 28 April 2026↗ x.com“It's almost been a decade since the last time this happened... The last time BTC decoupled from stocks to this degree was 2015 (prelude to the 2017 bull market).”
The first constructive post of the whole window. BTC closed at $79,822, near the top of the range it broke into in late August — up from $69,291 on 20 August. Read the claim precisely: it is not a price target but a regime analogue, equities and Bitcoin pulling apart the way they did in 2015, which he labels the prelude to the 2017 bull market. Price dipped to $75,590 (−5.3%) on 16 September, then ran +8.5% to $86,597 on 22 September and holds $84,359 (+5.7%). That leans his way, but three weeks cannot settle a claim about a multi-year decoupling. It also sits awkwardly beside his own 46k–54k bottom call above, and we will not reconcile the two for him. Open until price picks a side for longer.
𝕏 Post@willywoo on X — 6 September 2026↗ x.com“I put the probability the bottom is in at 90%. We are in an early bull market structure based on long term investor liquidity returning.”
The turn, stated as a number. BTC closed at $75,590 that day, then ran +14.6% to $86,597 on 22 September and holds $84,359 (+11.6%). Read the claim precisely: it is not that $75k was the low, but that the cycle bottom is already behind the market — on this chart that is $58,566 on 1 July, 8.5% above the top of the 46k–54k zone he pointed to in March, which this post quietly retires. He gave no time frame and no invalidation level. As of 27 September price agrees with him; a close back under the July low would settle it against him. Open.
𝕏 Post@willywoo on X — 16 September 2026↗ x.comWyniki to nasze odczytanie jego wypowiedzianego twierdzenia względem realnej ceny CoinGecko, a nie jego własna punktacja. Ceny to zamknięcia; „minimum po” to najniższe zamknięcie między wezwaniem a dniem dzisiejszym. Oznaczenia „otwarte” mogą się zmienić, gdy cykl się rozstrzygnie — wezwanie do strefy dna jest ostatecznie błędne dopiero wtedy, gdy cykl ostatecznie się kończy.
Woo sprzedaje badania, a nie sygnały czy tokeny — to czystsza struktura niż u większości w tym katalogu. Mimo to tworzy bodziec, który warto nazwać: płatny list o wyszukiwaniu dna cyklu jest najcenniejszy, dopóki dno jest wciąż przed nami.
Bitcoin Vector Lite na Substacku jest darmowy z płatnym poziomem; głębsze modele przepływów są za nim. Subskrypcje to widoczny biznes.
woobull.com i wskaźnik NVT są darmowe od lat — działają jako szczyt lejka i jako powód, dla którego w ogóle się go cytuje.
To jest ujawnienie, które ma znaczenie. W maju 2023 roku Syz Group ogłosiła SyzCrest Digital Uncorrelated, wspierany przez bank kryptowalutowy fundusz hedgingowy uruchomiony z Woo i CMCC Global, opisując go jako partnera zarządzającego CMCC Global & Crest Fund, doradcę funduszu Ama i partnera generalnego w S2F Fund; publikowane profile wymieniają też inwestycje seed w spółki kryptowalutowe. Te role pochodzą z prasy z 2023 roku i nie potwierdziliśmy, które z nich są nadal aktualne. Pozycje nie są ujawniane wpis po wpisie, więc traktuj każde konkretne wezwanie jako potencjalnie zbieżne z portfelem, którego nie widzisz.
“BTC MOVES TO A 6-8 YEAR CYCLE? BTC has been locked into the gravity of a 4 year orbit... it was subject to strong internal forces of its halvening... a clockwork 4yr supply rate shock. Meanwhile TradFi is on a 6-8 year short term debt cycle.”
03 Sep 2026 · całe jego podejście w jednym wpisie“3 things happen at the end of bear markets. 1) price cleanly breaks the cost basis of recent investors (circles). 2) idle smoking of hopium gives way to rabid clicking of the BUY button chasing the price 3) this raises the cost basis (red line transitions to green)”
05 Apr 2026 · długi horyzont pod niedźwiedzim rokiem“I could see a future where BTC trades sideways for 8-12 yrs remaining 5-6 figures, then 12-16 yrs out a god candle to multiple 7 figures.”
05 Apr 2026 · w połowie trafnie — bycza połowa chybiła o 25%“I’m bullish BTC late Jan through Feb but presently bearish for 2026.”
11 Jan 2026 · half right — the bullish half missed by 25%Cytaty przepisane z jego własnych publicznych filmów; wyrażone poglądy, nie rekomendacje.
Woo publikuje na piśmie, a nie przed kamerą — wykresy Woobull i cotygodniowy list Bitcoin Vector Lite. Jego dorobek wideo to cudze podcasty. Reprezentatywne wystąpienia:
 Bitcoin Needs To Adapt Now | With Willy WooLook Into Bitcoin — nagrane kilka dni po wezwaniu do dna 46k–54k powyżej.10 Apr 2026
 The Bull Market, Institutional Adoption & 2026 Recession? | Willy WooWhat Bitcoin Did — gdzie po raz pierwszy ujął 2026 rok jako prawdziwy test cyklu.26 Aug 2025
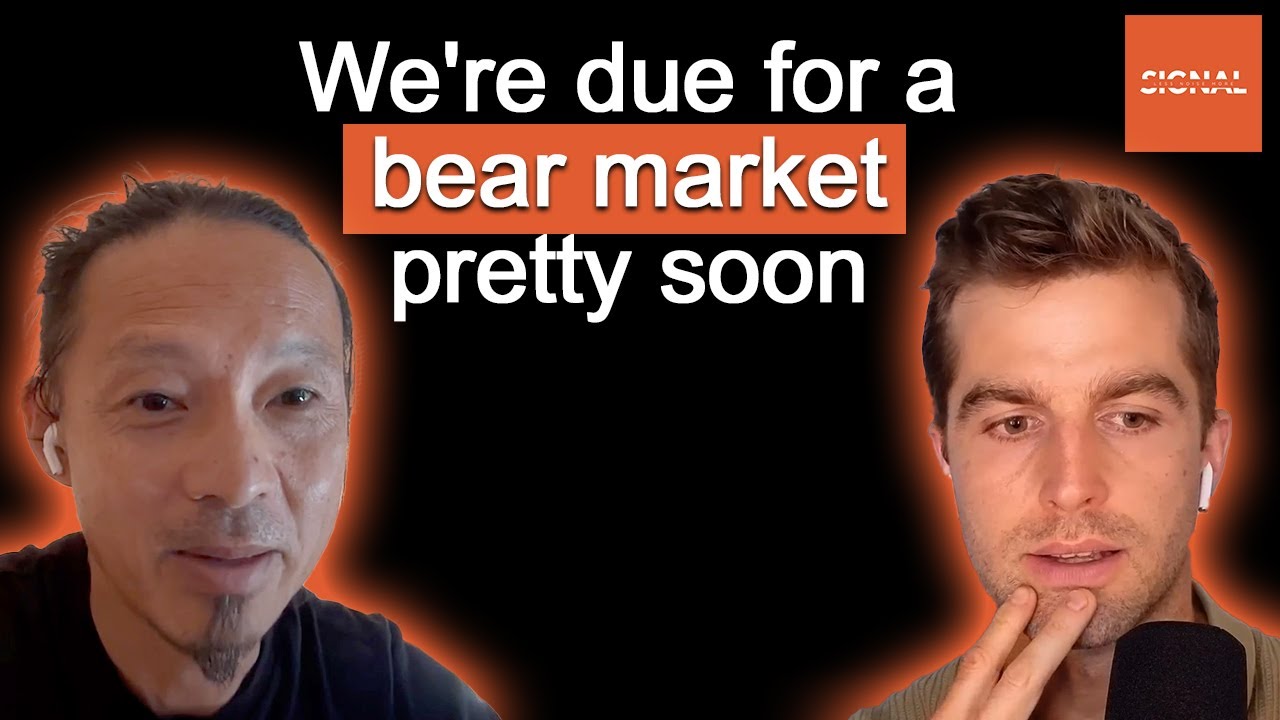 Trader legend Willy Woo: A 80% Bitcoin drawdown again is possibleLess Noise More Signal — scenariusz spadkowy, pół roku zanim był mu potrzebny.25 Sep 2025
 Bitcoin Whales Dumping As Liquidity Crisis Hits | Willy Woo Reveals The EndgameThe Wolf Of All Streets — ze Scottem Melkerem, którego dossier też jest w tym katalogu.14 Sep 2025
Analityk on-chain Bitcoina, najbardziej znany ze spopularyzowania wskaźnika NVT — wartości sieci podzielonej przez wolumen transakcji, przedstawionej jako „Bitcoin's P/E ratio” — oraz z biblioteki wykresów Woobull. Pisze cotygodniowy list Bitcoin Vector Lite na Substacku i ma około 1,1 mln obserwujących na X, gdzie publikuje teraz jako @willywoo (wcześniej @woonomic).
For most of 2026 he was bearish: his on-chain models pointed to a bottom between $46,000 and $54,000, with the CVDD floor near $45,500 when he said it in March. That zone has not printed — Bitcoin's lowest close since was $58,566 on 1 July. On 16 September 2026 he reversed, putting the probability that the bottom is in at 90% and calling the market an early bull structure. Separately, he has floated a much longer-horizon view of Bitcoin trading sideways for 8–12 years before a move to seven figures.
Różnie, a wzorzec jest spójny: mocny w kierunku, słaby w skali. W tym oknie jego lutowe wezwanie do odrzucenia i marcowy poziom oporu sprawdziły się precyzyjnie, a jego kwietniowe odczytanie, że elementy dna nie są jeszcze na miejscu, potwierdził spadek o 24%. Ale jego strefa dna $46k–$54k nigdy nie nadeszła, jego cel z 2021 roku $250k–$300k chybił mniej więcej czterokrotnie, a jego wpis ze stycznia 2026 roku — „I'm bullish BTC late Jan through Feb but presently bearish for 2026” — wpuścił byczą połowę prosto w spadek o 25%.
Najbardziej znany wskaźnik Woo: wartość sieci Bitcoina (kapitalizacja) podzielona przez wartość w dolarach przetransferowaną w łańcuchu. Wysoki odczyt sugeruje, że cena wybiegła przed ekonomiczne wykorzystanie sieci; niski sugeruje odwrotność. Przedstawił go jako on-chainowy odpowiednik wskaźnika cena/zysk akcji, i otworzył tym drzwi całej dziedzinie analityki on-chain.
Woo ignoruje świecę i idzie za pieniędzmi — przepływy, koszty bazowe i cierpliwość, by przesiedzieć miesiące bocznego rynku. Jak blisko jest twój instynkt? Zmierz to naprawdę z Trader Passport.
Teraz sprawdź, co naprawdę się opłaca. Przetestuj swoją przewagę na żywych danych rynkowych — bez ryzyka kapitału — w darmowym turnieju BuyCrypt z prawdziwymi nagrodami.
Analiza informacyjna i edukacyjna oparta wyłącznie na materiałach publicznie dostępnych — jego własnych datowanych wpisach na X (przechwyconych dosłownie przez publiczny endpoint syndykacji X) oraz datowanych publikacjach osób trzecich, linkowanych przy każdym wezwaniu. To nie jest porada finansowa ani inwestycyjna. Liczby są przybliżone i stale się zmieniają. Spotted an error, or are you Willy? Zgłoś poprawkę →
Zweryfikowane konta · Źródła cytowane powyżej · Metodologia oceniania · Zaktualizowano 27 September 2026

















