
@KevinSvenson_
A chart trader who puts a number on almost every setup — a 🎯 target, a Fibonacci level, a bottom zone — and posts it with a date. That makes him easy to grade. In 2026 his bullish reversal calls landed: a $79,500 squeeze target in April and a cycle-low call at $59K in June. His March call for a bottom around $50K got the direction right but the level wrong. In October his 48-hour breakout calls for $92K Bitcoin and $3,200 Ethereum missed, and his September ETH and “bear market is over” calls are still open.
W skrócie. Kevin Svenson posts Bitcoin and Ethereum chart analysis to about 163,000 followers on X and runs the Kevin Svenson Crypto YouTube channel. His bio lists him as CTO of AltvsBtc.com. On our sample of seven in-window posts the record is 2 played out, 3 open, 2 went against. On 15 April he targeted $79,500 from $74,297, and Bitcoin closed above it on 5 May. On 29 June, at $59,495, he said the setup “has marked every major cycle low” — Bitcoin dipped only 1.6% further and is up 37.4% since. His 26 March call for “1 more leg down” to a bottom around $50K is graded open-mixed: the leg down came, but the low was $58,566, nowhere near $50K. On 3 October he gave Bitcoin $92,000 and Ethereum $3,200 within “the next 48 hours”; neither broke out, and both are below their call prices. Outside this chart window, his 2025 top call of $140,000–$150,000 missed (Bitcoin peaked near $126K).
Svenson publikuje jako @KevinSvenson_ na X, gdzie jego kanał to głównie dzienne i tygodniowe wykresy Bitcoina, Ethereum i indeksów altcoinów, każdy z nazwą formacji i celem. Prowadzi też kanał YouTube Kevin Svenson Crypto; według Daily Hodl we wrześniu 2025 roku miał on około 83,900 subskrybentów. Jego materiały to długie „strategy sessions” o strukturze cyklu, dominacji Bitcoina i sezonach altcoinów. Biogram na X przedstawia go jako CTO AltvsBtc.com, serwisu zestawiającego altcoiny z Bitcoinem, i zawiera linki do dwóch innych produktów, agent4663.tech i TokenTicker.app, a także link polecający do giełdy. Nie znaleźliśmy publicznych informacji o jego kraju, wieku ani wcześniejszej karierze, dlatego ta strona ich nie podaje.
Ma też udokumentowaną pomyłkę spoza tego okna wykresu. W lipcu 2025 roku mówił widzom, że Bitcoin wchodzi w „vertical stage”, i szacował „$140,000 – $150,000” jako kolejną strefę szczytu, „maybe around October”. We wrześniu 2025 roku powtórzył $140,000–$150,000, ze szczytem w okresie od listopada do stycznia. Bitcoin osiągnął szczyt w okolicach $126,000 w październiku 2025 roku, a następnie wpadł w rynek niedźwiedzia 2026 roku. Moment szczytu wskazał blisko; poziomu — nie. Zaimki na tej stronie są zgodne z użyciem w prasie (Daily Hodl pisze „he”); on sam ich nie określił.
Sources: x.com/KevinSvenson_ (captured via api.fxtwitter.com and X syndication) · YouTube channel UCVTbGN6Hzi4sSAz1bKHiDiQ · dailyhodl.com coverage (2025)
Classical chart patterns with explicit targets. He names the pattern (continuation, short-squeeze setup, rejection candles), marks the trigger, and posts a 🎯 target, often tied to a Fibonacci extension such as the 1.272. On longer timeframes he leans on cycle analogies — parabolic-curve bases, “every major cycle low for 15 years” — and sentiment extremes. The strength is that his calls are falsifiable: a number and a date. The weakness shows on cycle-scale levels: the $50K bottom and the 2025 $140,000–$150,000 top were both off by well over 10%, even when the direction was right. Short windows cut both ways too: his October 48-hour breakout calls for Bitcoin and Ethereum missed.
Bullish since the summer low. He called the cycle low on 29 June and declared the bear market over on 21 September. In this sample his only bearish call was the March “1 more leg down”, which he framed as the last drop before a year of accumulation. He stayed bullish into October, calling $92K Bitcoin on 3 and 6 October and saying on 12 October the weekly close was “in the bulls favor now”.
Seven dated posts from @KevinSvenson_, each captured verbatim from X and charted against real price. The tally is 2 played out, 3 open, 2 went against. The wins are the $79,500 squeeze target in April and the cycle-low call at $59,495 in June. The misses are his 3 October 48-hour breakout calls: $92,000 Bitcoin and $3,200 Ethereum. His March call for a $50K bottom is graded open-mixed: the leg down happened, the level did not. The September ETH target and the “bear market is officially over” call are still open, and both are back near or below their call prices.
“A push through local highs puts $92K in play. The chart says breakout in the next 48 hours.”
A “next daily target” of $92,000, about +8.9% above Bitcoin's $84,506 mark that day, with a 48-hour window for the breakout. Bitcoin's best mark after the post was $86,490 (+2.3%) on 5 October, still under the 22 September local high of $86,597. He repeated “$92,000 🎯 on next leg up” on 6 October, at $85,771. The breakout did not come: Bitcoin fell to $81,408 (−3.7%) and sits at $81,764 (−3.2%), with $92K still 12.5% away. On daily marks the 48 hours passed without the breakout, so we grade it went against.
𝕏 Post“$92,000 #Bitcoin 🟠 next daily target 🎯” — @KevinSvenson_ on X↗ x.com“A break of local highs puts $3,200 in play. Same window as Bitcoin: the next 48 hours decide.”
The Ethereum half of the same thread: a break of local highs would put $3,200 in play, about +19.9% above ETH's $2,668 mark, within the same 48 hours. ETH peaked at $2,726 (+2.2%) on 5 October, below its 22 September high of $2,775. It then dropped to $2,400 (−10.0%) and sits at $2,418 (−9.4%). The 48 hours passed without the break, and price fell — went against.
𝕏 Post“#Ethereum🔹 is tracking the same daily structure.” — @KevinSvenson_ on X↗ x.com“The bear market is officially over.”
A regime call, posted with “bull market loading” for Bitcoin, Ethereum and altcoins. Bitcoin was at $81,169, and that day's mark is still the floor: it has not closed lower since. It ran to $86,597 (+6.7%) the next day, but gave it all back: the lowest mark since is $81,408 on 18 October, and Bitcoin sits at $81,764 (+0.7%). Four weeks on it is flat, not a bull market yet, and not a new low either — open.
𝕏 Post“The bear market is officially over.” — @KevinSvenson_ on X↗ x.com“#ETHEREUM 🔷 Daily Chart Continuation pattern 🎯 Target = $3,380”
A daily-chart continuation pattern with a $3,380 target, about +36% above Ethereum's $2,485 mark that day. So far ETH dipped to $2,397 (−3.5%), then rose to $2,775 (+11.7%) on 22 September, but has slid back to $2,418 (−2.7%), below the call price. The target is now 39.8% away. Still open, but leaning against him.
𝕏 Post“#ETHEREUM 🔷 Daily Chart Continuation pattern 🎯 Target = $3,380” — @KevinSvenson_ on X↗ x.com“This exact setup has marked every major cycle low for $BTC for the last 15 years. It's time to start betting against the crowd”
With Bitcoin at $59,495, in “Extreme Fear” and below its two-year cost basis, he called a cycle-low setup and said to bet against the crowd. It was within a whisker of the bottom: Bitcoin dipped only −1.6% to $58,566 on 1 July, its 2026 low, then ran to $86,597 (+45.6%). It sits at $81,764 (+37.4%). Played out.
𝕏 Post“This exact setup has marked every major cycle low” — @KevinSvenson_ on X↗ x.com“If we reclaim and confirm price action above yesterday’s wick high, a trapped liquidity short squeeze initiates. Targeting 🎯 $79,500 (coincides with 1.272 Fib)”
Warunkowy układ pod short squeeze od $74,297, z celem $79,500 (około +7%). Bitcoin spadł do $73,841 20 kwietnia, a następnie zamknął się powyżej celu, przy $79,826, 5 maja i osiągnął szczyt $82,018 11 maja. Squeeze nie trwał długo: do 1 lipca Bitcoin spadł do $58,566 (−21.2%). Cel został osiągnięty — sprawdziło się.
𝕏 Post“Targeting 🎯 $79,500 (coincides with 1.272 Fib)” — @KevinSvenson_ on X↗ x.com“1 more leg down seems about right. Then a bottom will form around $50K, we exit the downtrend, and we enter general accumulation for the rest of the year.”
From $71,304 he expected one more leg down to a bottom around $50K. Bitcoin first rallied to $82,018 on 11 May, then made that leg down to $58,566 (−17.9%) on 1 July, and has recovered to $81,764 (+14.7%). The shape he described happened — a final drop, then a turn — but the floor came in $8,566 above wskazany poziom. Bitcoin never got near $50K. We grade it mixed: direction right, level wrong.
𝕏 Post“Then a bottom will form around $50K” — @KevinSvenson_ on X↗ x.comWyniki to nasza ocena jego deklaracji na tle rzeczywistej ceny, a nie jego własna punktacja. Każdy cytat to dosłowny wpis z X, podlinkowany na karcie i odtworzony w całości w zweryfikowanym korpusie. Ceny to dzienne notowania CoinGecko, więc wpis opublikowany w ciągu dnia mierzony jest od notowania z tego dnia, a knot przebijający poziom może się nie pojawić. Linia „$1,000 in on their call” na tej stronie to strategia kup i trzymaj od daty wezwania; nie modeluje krótkiej sprzedaży. Jego prognoza szczytu na 2025 rok w przedziale $140,000–$150,000 wykracza poza okno cenowe i nie jest na wykresie, ale opisujemy ją w części o tle. Krótkoterminowe oceny mogą się zmienić w miarę rozstrzygania się cyklu.
Svenson's business mixes content with products and an exchange partnership. None of it is hidden — it is in his X bio and his own posts — but it is worth knowing before you act on a chart.
Jego biogram na X i wiele wpisów z wykresami zawiera link partnerski BloFin (partner.blofin.com/d/KevinSvenson), a na jego kanale YouTube jest poradnik BloFin dotyczący handlu spot i kontraktami futures. Linki polecające zwykle zapewniają publikującemu udział w opłatach transakcyjnych osób, które się zarejestrują, a handel kontraktami futures generuje więcej opłat niż samo trzymanie aktywów.
Biogram przedstawia go jako CTO AltvsBtc.com i zawiera linki do TokenTicker.app oraz agent4663.tech. Promuje je w swoich wpisach; na przykład 28 września zachwalał TokenTicker jako najprostszy sposób, by zobaczyć, które tickery się ruszają. Nie znaleźliśmy publicznych cenników tych produktów.
He also launches crypto tokens. On 26 August he posted “I launched a meme coin that airdrops $NVDA, $TSLA, $AMZN, $AAPL, and $SPY stock tokens simply by holding the token” — $StonkATM, on Robinhood Chain, which charges traders a fee when they sell. On 28 September he posted that “$TICKER holders will get access to paid features post graduation”, linking a Pons launchpad page, and his feed reposts other Pons launchpad tokens. A launcher can gain when his audience buys; we found no public disclosure of what he holds.
Kanał Kevin Svenson Crypto zarabia na wyświetleniach i ewentualnych sponsoringach. Byczo nastawione, energiczne tytuły („The Bull Market Starts NOW?!”) zwykle przyciągają więcej wyświetleń, co jest ogólną zachętą, o której warto pamiętać.
“This exact setup has marked every major cycle low for $BTC for the last 15 years. It's time to start betting against the crowd”
29 Jun 2026 · wskazanie dołka cyklu, które się utrzymało“Then a bottom will form around $50K”
26 Mar 2026 · poziom, który nigdy nie nadszedł“The bear market is officially over.”
21 Sep 2026 · wezwanie zmiany reżimu wciąż otwarteCytaty pochodzą z własnych publicznych źródeł; to wyrażone opinie, nie rekomendacje.
Svenson publikuje długie sesje z wykresami na swoim kanale YouTube Kevin Svenson Crypto. Reprezentatywne niedawne materiały:
 Robinhood Chain Triggered the Next Bull Cycle — Alt Season Is Here #Bitcoin #Ethereum #RobinhoodJego argumenty za tym, że cykl altcoinów się rozpoczął.11 Sep 2026
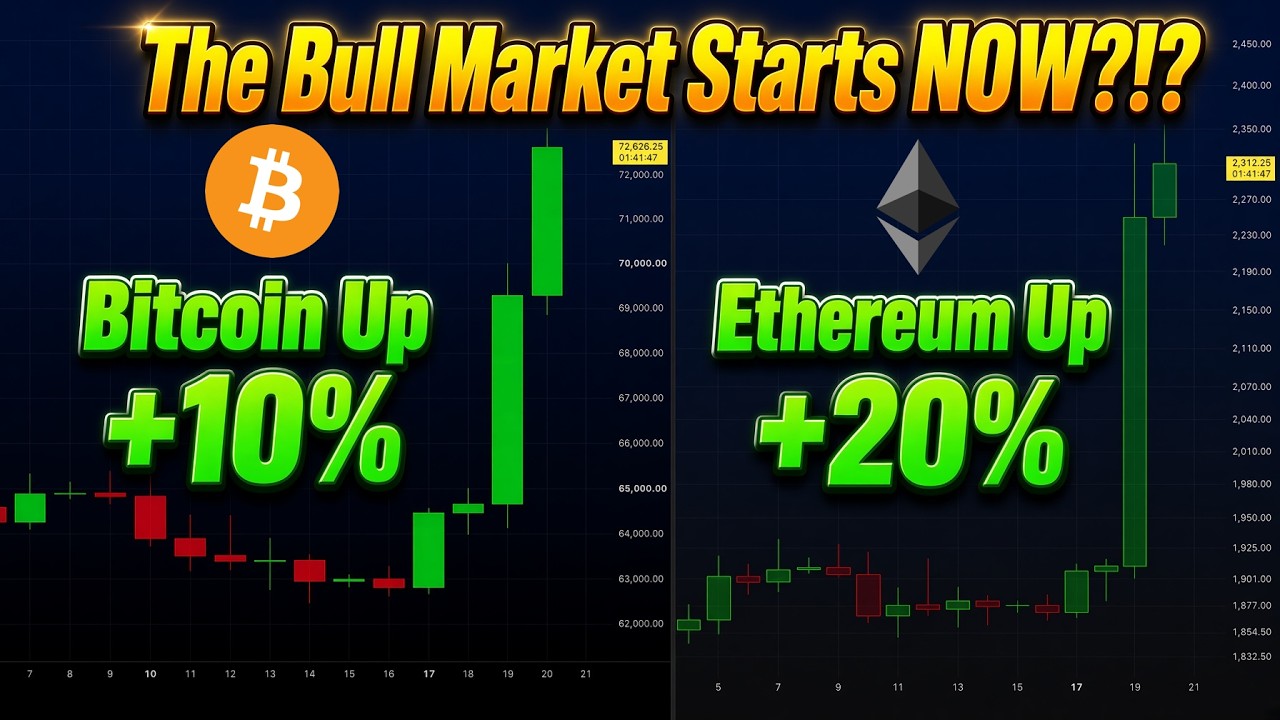 #Bitcoin +10% & #Ethereum +20% – The Bull Market Starts NOW?!Sierpniowe odbicie odczytane jako początek byczej fali.20 Aug 2026
 This #Bitcoin Bottom Signal Has NEVER Been WrongSygnał dołka cyklu stojący za jego wezwaniem z 29 czerwca.3 Jul 2026
 BIG SHIFT COMING FOR #BITCOIN #STOCKS $ALTS $ONDO $LINK $HYPESpojrzenie na wiele rynków w pobliżu majowych szczytów.8 May 2026
Analitykiem wykresów kryptowalut, który publikuje układy dla Bitcoina i Ethereum z wyraźnymi celami dla około 163,000 obserwujących na X (@KevinSvenson_) i prowadzi kanał YouTube Kevin Svenson Crypto. Biogram na X przedstawia go jako CTO AltvsBtc.com.
On our sample of seven dated 2026 posts: two played out, three are open, two went against. His April $79,500 target was hit on 5 May, and his 29 June cycle-low call came within 1.6% of the 2026 low. His 3 October calls for $92,000 Bitcoin and $3,200 Ethereum within 48 hours missed. His March call for a bottom around $50K missed the level (the low was $58,566), and his 2025 top target of $140,000–$150,000 missed (Bitcoin peaked near $126,000).
Indirectly. His posts and bio carry a BloFin exchange referral link, he promotes his own products (AltvsBtc.com, TokenTicker.app), he has launched his own tokens ($StonkATM in August 2026), and he earns from YouTube. We found no paid signal group.
Classical chart patterns with a trigger and a 🎯 target, often a Fibonacci extension, plus cycle analogies and sentiment extremes for the bigger picture. His record on near-term targets is mixed: two hits (April and June) and two 48-hour misses (October). His cycle-scale levels have been further off.
Svenson gra formację i publikuje liczbę. Jak blisko jest twój instynkt? Zmierz to naprawdę z Trader Passport.
Teraz wykorzystaj swoje podejście w praktyce. Sprawdź swoją przewagę na danych rynkowych na żywo, bez ryzykowania kapitału, w darmowym turnieju BuyCrypt z prawdziwymi nagrodami.
Analiza informacyjna i edukacyjna oparta wyłącznie na publicznie dostępnych materiałach: datowanych wpisach z X pobranych z publicznych endpointów X oraz źródłach podlinkowanych przy każdej prognozie. Nie stanowi porady finansowej ani inwestycyjnej. Liczby są przybliżone i stale się zmieniają. Spotted an error, or are you Kevin? Zgłoś poprawkę →
Zweryfikowane konta · Źródła cytowane powyżej · Metodologia oceniania · Zaktualizowano 18 October 2026