
@KevinSvenson_
A chart trader who puts a number on almost every setup — a 🎯 target, a Fibonacci level, a bottom zone — and posts it with a date. That makes him easy to grade. In 2026 his bullish reversal calls landed: a $79,500 squeeze target in April and a cycle-low call at $59K in June. His March call for a bottom around $50K got the direction right but the level wrong. In October his 48-hour breakout calls for $92K Bitcoin and $3,200 Ethereum missed, and his September ETH and “bear market is over” calls are still open.
简而言之。 Kevin Svenson posts Bitcoin and Ethereum chart analysis to about 163,000 followers on X and runs the Kevin Svenson Crypto YouTube channel. His bio lists him as CTO of AltvsBtc.com. On our sample of seven in-window posts the record is 2 played out, 3 open, 2 went against. On 15 April he targeted $79,500 from $74,297, and Bitcoin closed above it on 5 May. On 29 June, at $59,495, he said the setup “has marked every major cycle low” — Bitcoin dipped only 1.6% further and is up 37.4% since. His 26 March call for “1 more leg down” to a bottom around $50K is graded open-mixed: the leg down came, but the low was $58,566, nowhere near $50K. On 3 October he gave Bitcoin $92,000 and Ethereum $3,200 within “the next 48 hours”; neither broke out, and both are below their call prices. Outside this chart window, his 2025 top call of $140,000–$150,000 missed (Bitcoin peaked near $126K).
Svenson 在 X 上以 @KevinSvenson_ 发帖,内容主要是比特币、以太坊和山寨币指数的日线与周线图,每张都附有形态名称和目标位。他还运营 Kevin Svenson Crypto YouTube 频道;据 Daily Hodl 报道,2025年9月该频道约有 83,900 名订阅者。他的视频是关于周期结构、比特币市占率和山寨季的长篇“策略讲解”。他的 X 简介称他为 AltvsBtc.com 首席技术官,该网站将山寨币与比特币对比绘图;简介中还链接了另外两款产品 agent4663.tech 和 TokenTicker.app,以及一个交易所推荐链接。我们未找到关于他国籍、年龄或过往职业的公开记录,因此本页不作说明。
他还有一次有据可查、但位于本图表窗口之外的失误。2025年7月,他告诉观众比特币正进入“vertical stage”,并估计下一个顶部区间为 “$140,000 – $150,000”,“maybe around October”。2025年9月,他重申 $140,000–$150,000,顶部时间在11月至1月前后。比特币于2025年10月在约 $126,000 见顶,随后跌入2026年熊市。他对顶部时间的判断接近,点位则不然。本页的人称代词遵循媒体用法(Daily Hodl 使用“he”);他本人未作说明。
Sources: x.com/KevinSvenson_ (captured via api.fxtwitter.com and X syndication) · YouTube channel UCVTbGN6Hzi4sSAz1bKHiDiQ · dailyhodl.com coverage (2025)
Classical chart patterns with explicit targets. He names the pattern (continuation, short-squeeze setup, rejection candles), marks the trigger, and posts a 🎯 target, often tied to a Fibonacci extension such as the 1.272. On longer timeframes he leans on cycle analogies — parabolic-curve bases, “every major cycle low for 15 years” — and sentiment extremes. The strength is that his calls are falsifiable: a number and a date. The weakness shows on cycle-scale levels: the $50K bottom and the 2025 $140,000–$150,000 top were both off by well over 10%, even when the direction was right. Short windows cut both ways too: his October 48-hour breakout calls for Bitcoin and Ethereum missed.
Bullish since the summer low. He called the cycle low on 29 June and declared the bear market over on 21 September. In this sample his only bearish call was the March “1 more leg down”, which he framed as the last drop before a year of accumulation. He stayed bullish into October, calling $92K Bitcoin on 3 and 6 October and saying on 12 October the weekly close was “in the bulls favor now”.
Seven dated posts from @KevinSvenson_, each captured verbatim from X and charted against real price. The tally is 2 played out, 3 open, 2 went against. The wins are the $79,500 squeeze target in April and the cycle-low call at $59,495 in June. The misses are his 3 October 48-hour breakout calls: $92,000 Bitcoin and $3,200 Ethereum. His March call for a $50K bottom is graded open-mixed: the leg down happened, the level did not. The September ETH target and the “bear market is officially over” call are still open, and both are back near or below their call prices.
“A push through local highs puts $92K in play. The chart says breakout in the next 48 hours.”
A “next daily target” of $92,000, about +8.9% above Bitcoin's $84,506 mark that day, with a 48-hour window for the breakout. Bitcoin's best mark after the post was $86,490 (+2.3%) on 5 October, still under the 22 September local high of $86,597. He repeated “$92,000 🎯 on next leg up” on 6 October, at $85,771. The breakout did not come: Bitcoin fell to $81,408 (−3.7%) and sits at $81,764 (−3.2%), with $92K still 12.5% away. On daily marks the 48 hours passed without the breakout, so we grade it went against.
𝕏 Post“$92,000 #Bitcoin 🟠 next daily target 🎯” — @KevinSvenson_ on X↗ x.com“A break of local highs puts $3,200 in play. Same window as Bitcoin: the next 48 hours decide.”
The Ethereum half of the same thread: a break of local highs would put $3,200 in play, about +19.9% above ETH's $2,668 mark, within the same 48 hours. ETH peaked at $2,726 (+2.2%) on 5 October, below its 22 September high of $2,775. It then dropped to $2,400 (−10.0%) and sits at $2,418 (−9.4%). The 48 hours passed without the break, and price fell — went against.
𝕏 Post“#Ethereum🔹 is tracking the same daily structure.” — @KevinSvenson_ on X↗ x.com“The bear market is officially over.”
A regime call, posted with “bull market loading” for Bitcoin, Ethereum and altcoins. Bitcoin was at $81,169, and that day's mark is still the floor: it has not closed lower since. It ran to $86,597 (+6.7%) the next day, but gave it all back: the lowest mark since is $81,408 on 18 October, and Bitcoin sits at $81,764 (+0.7%). Four weeks on it is flat, not a bull market yet, and not a new low either — open.
𝕏 Post“The bear market is officially over.” — @KevinSvenson_ on X↗ x.com“#ETHEREUM 🔷 Daily Chart Continuation pattern 🎯 Target = $3,380”
A daily-chart continuation pattern with a $3,380 target, about +36% above Ethereum's $2,485 mark that day. So far ETH dipped to $2,397 (−3.5%), then rose to $2,775 (+11.7%) on 22 September, but has slid back to $2,418 (−2.7%), below the call price. The target is now 39.8% away. Still open, but leaning against him.
𝕏 Post“#ETHEREUM 🔷 Daily Chart Continuation pattern 🎯 Target = $3,380” — @KevinSvenson_ on X↗ x.com“This exact setup has marked every major cycle low for $BTC for the last 15 years. It's time to start betting against the crowd”
With Bitcoin at $59,495, in “Extreme Fear” and below its two-year cost basis, he called a cycle-low setup and said to bet against the crowd. It was within a whisker of the bottom: Bitcoin dipped only −1.6% to $58,566 on 1 July, its 2026 low, then ran to $86,597 (+45.6%). It sits at $81,764 (+37.4%). Played out.
𝕏 Post“This exact setup has marked every major cycle low” — @KevinSvenson_ on X↗ x.com“If we reclaim and confirm price action above yesterday’s wick high, a trapped liquidity short squeeze initiates. Targeting 🎯 $79,500 (coincides with 1.272 Fib)”
一个从 $74,297 起的有条件轧空形态,目标位 $79,500(约 +7%)。比特币于4月20日跌至 $73,841,随后于5月5日收于目标之上的 $79,826,并于5月11日在 $82,018 见顶。轧空行情未能持续:至7月1日,比特币跌至 $58,566(−21.2%)。目标已达成——已应验。
𝕏 Post“Targeting 🎯 $79,500 (coincides with 1.272 Fib)” — @KevinSvenson_ on X↗ x.com“1 more leg down seems about right. Then a bottom will form around $50K, we exit the downtrend, and we enter general accumulation for the rest of the year.”
From $71,304 he expected one more leg down to a bottom around $50K. Bitcoin first rallied to $82,018 on 11 May, then made that leg down to $58,566 (−17.9%) on 1 July, and has recovered to $81,764 (+14.7%). The shape he described happened — a final drop, then a turn — but the floor came in $8,566 above 所提到的位置. Bitcoin never got near $50K. We grade it mixed: direction right, level wrong.
𝕏 Post“Then a bottom will form around $50K” — @KevinSvenson_ on X↗ x.com结果是我们依据真实价格对其所述观点的解读,而非他本人的评分。每条引文均为 X 帖子原文,链接见其卡片,并完整收录于已核实资料库。价格采用 CoinGecko 每日标记价,因此盘中帖子以当日标记价计算,穿越某一价位的影线可能不会显示。本页“$1,000 in on their call”一行是从判断日起买入并持有的计算,不模拟做空。他2025年 $140,000–$150,000 的顶部判断在价格窗口之外,未绘入图表,但在背景部分有所描述。随着周期演变,短期标记可能发生反转。
Svenson's business mixes content with products and an exchange partnership. None of it is hidden — it is in his X bio and his own posts — but it is worth knowing before you act on a chart.
他的 X 简介和许多图表帖子都附有 BloFin 合作链接(partner.blofin.com/d/KevinSvenson),他的 YouTube 频道还有一个 BloFin 现货与期货教程。推荐链接通常会将注册用户交易手续费的一部分支付给发布者,而期货交易产生的手续费比持有更多。
他的简介称他为 AltvsBtc.com 首席技术官,并链接了 TokenTicker.app 和 agent4663.tech。他会在帖子中推广这些产品;例如,9月28日他将 TokenTicker 宣传为查看哪些代币正在异动的最简便方式。我们未找到这些产品的公开定价。
He also launches crypto tokens. On 26 August he posted “I launched a meme coin that airdrops $NVDA, $TSLA, $AMZN, $AAPL, and $SPY stock tokens simply by holding the token” — $StonkATM, on Robinhood Chain, which charges traders a fee when they sell. On 28 September he posted that “$TICKER holders will get access to paid features post graduation”, linking a Pons launchpad page, and his feed reposts other Pons launchpad tokens. A launcher can gain when his audience buys; we found no public disclosure of what he holds.
Kevin Svenson Crypto 频道通过观看量和可能的赞助获得收入。看涨、高能量的标题(“The Bull Market Starts NOW?!”)往往能吸引更多观看,这是一种值得留意的普遍激励。
“This exact setup has marked every major cycle low for $BTC for the last 15 years. It's time to start betting against the crowd”
29 Jun 2026 · 守住了的周期低点判断“Then a bottom will form around $50K”
26 Mar 2026 · 从未到来的点位“The bear market is officially over.”
21 Sep 2026 · 仍未定论的格局判断引文取自其本人的公开来源;这些是表达过的观点,不是投资建议。
Svenson 在他的 Kevin Svenson Crypto YouTube 频道发布较长的图表讲解。近期代表性视频:
 Robinhood Chain Triggered the Next Bull Cycle — Alt Season Is Here #Bitcoin #Ethereum #Robinhood他关于山寨币周期已经开始的论证。11 Sep 2026
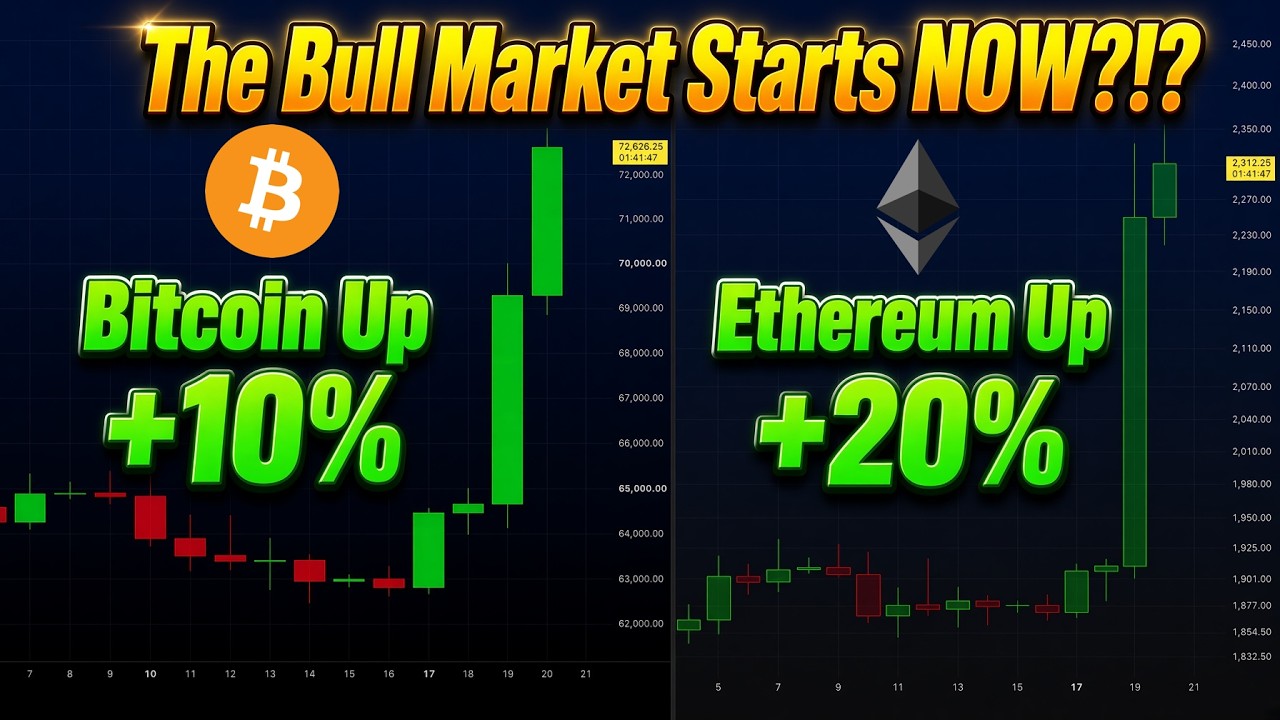 #Bitcoin +10% & #Ethereum +20% – The Bull Market Starts NOW?!8月的反弹,被解读为牛市一段的开端。20 Aug 2026
 This #Bitcoin Bottom Signal Has NEVER Been Wrong他6月29日判断背后的周期低点信号。3 Jul 2026
 BIG SHIFT COMING FOR #BITCOIN #STOCKS $ALTS $ONDO $LINK $HYPE5月高点附近的跨市场观点。8 May 2026
一位加密图表分析师,在 X(@KevinSvenson_)上向约 163,000 名关注者发布带明确目标的比特币和以太坊形态分析,并运营 Kevin Svenson Crypto YouTube 频道。他的 X 简介称他为 AltvsBtc.com 首席技术官。
On our sample of seven dated 2026 posts: two played out, three are open, two went against. His April $79,500 target was hit on 5 May, and his 29 June cycle-low call came within 1.6% of the 2026 low. His 3 October calls for $92,000 Bitcoin and $3,200 Ethereum within 48 hours missed. His March call for a bottom around $50K missed the level (the low was $58,566), and his 2025 top target of $140,000–$150,000 missed (Bitcoin peaked near $126,000).
Indirectly. His posts and bio carry a BloFin exchange referral link, he promotes his own products (AltvsBtc.com, TokenTicker.app), he has launched his own tokens ($StonkATM in August 2026), and he earns from YouTube. We found no paid signal group.
Classical chart patterns with a trigger and a 🎯 target, often a Fibonacci extension, plus cycle analogies and sentiment extremes for the bigger picture. His record on near-term targets is mixed: two hits (April and June) and two 48-hour misses (October). His cycle-scale levels have been further off.
Svenson 交易形态并公布数字。你的直觉与他有多接近?用 Trader Passport 实际测一测。