
@willywoo
The analyst who made “on-chain” a category. Woo doesn't read candles — he reads where money actually moves: investor flows, realised prices, the cost basis of recent buyers. Through most of 2026 that model kept him bearish while the rest of crypto looked for a bottom, and the price mostly agreed with him. Where it didn't, it didn't by a wide margin — his 46k–54k bottom zone never printed. In September, with long-term liquidity returning, he turned: on 16 September he put 90% odds on the bottom being in.
Em resumo. Willy Woo is one of the original Bitcoin on-chain analysts — creator of the NVT ratio (“Bitcoin's P/E”), publisher of the Woobull chart library, and author of the weekly Bitcoin Vector Lite letter on Substack. His framework is deliberately not technical analysis: he models investor liquidity flows and compares price against on-chain cost bases (short-term-holder price, realised price, the CVDD floor) to say where the market is in its cycle. For most of 2026 that model made him one of the most consistently bearish major voices — and, for the levels that mattered, largely right: he called the March rally a bull trap and it was rejected exactly where he said. He is also on record with targets that never arrived, from $250k in 2021 to a 46k–54k bottom this year — a zone he effectively retired in September, when he called the bottom in at 90% odds.
Woo chegou aos mercados vindo do software — os perfis publicados descrevem um programador nascido em Hong Kong e criado na Nova Zelândia que construiu e vendeu startups antes de passar ao trading, e que comprou o seu primeiro bitcoin no final de 2013. O que lhe fez o nome não foi um negócio, mas uma métrica: em 2017 popularizou o rácio NVT, valor de rede a dividir pelo volume de transações, apresentado como «Bitcoin's P/E ratio». Tornou-se a primeira ferramenta de avaliação on-chain de uso alargado, e a biblioteca de gráficos Woobull que cresceu à sua volta continua a ser uma referência padrão. Hoje publica Bitcoin Vector Lite semanalmente no Substack — «views into BTC's underlying structure through the lens of investor flows» — com um nível pago por trás.
The record cuts both ways and the misses are large. On 29 April 2021 he told SALT Talks that Bitcoin “could reach $250K to $300K by the end of that cycle”, later stretching it to $300K–$400K on institutional inflows; Bitcoin topped near $69,000 that November. In September 2025, with BTC just off a $124,457 record, he suggested it “could race up to $140,000–$160,000” — while adding he couldn't tell. It never did. And on 11 January 2026 he posted “I'm bullish BTC late Jan through Feb but presently bearish for 2026”: the bearish half aged well, the bullish half did not — Bitcoin fell from $89,212 on 29 January to $67,017 by 1 March, −25% straight through the window he was bullish on. That January post sits just outside the chart below; the seven calls that follow are all inside it.
Sources: x.com/willywoo (verified via X syndication) · woobull.com · willywoo.substack.com · Bitcoin.com News · Yahoo Finance
Primeiro os fluxos, depois o preço. A unidade de análise de Woo é o capital, não a vela: quanto dinheiro real entra ou sai do Bitcoin e como isso se compara com o momentum de preço que supostamente deve sustentar. As ferramentas recorrentes são custos base on-chain — o preço dos detentores de curto prazo (o ponto de equilíbrio de quem comprou nos últimos 155 dias), o preço realizado e o piso CVDD — mais os seus próprios modelos de fluxo de investidores e um olhar sobre o risco cruzado (volatilidade acionista, liquidez macro). Isso dá-lhe estrutura e paciência: ele diz «Still weeks more in this mid bear consolidation» e é a sério. A fraqueza é simétrica. Os modelos de fluxo são bons no regime (baixa ou alta) e maus na magnitude — as suas chamadas direcionais aguentaram muito melhor do que os números concretos que as acompanham.
Bearish on 2026 from January through the summer — his flow models had liquidity waning against price since January 2025. September is where that changed. On 6 September 2026 he flagged Bitcoin decoupling from equities as it did in 2015, and on 16 September he put the probability that the bottom is in at 90%, calling the market an early bull structure on returning long-term investor liquidity. His longer view is unchanged: Bitcoin in seven figures, but over a 12–16 year horizon.
Seven dated 2026 posts, charted against real price from the day he said them. Every quote below was pulled from X's own syndication endpoint or from the dated article that carries it — nothing is paraphrased. Woo trades in regimes and levels rather than one-line targets, so each card scores the specific claim he made: did the rejection happen where he said, did the level break, did the bottom print in the zone. He was right on the shape of the market in Feb–April and wrong on how deep it would go; the two newest cards, from September, are the first in this window pointing up — ending with his call that the bottom is in.
“This bearish sell down by investors seems to have exhausted, which gives price a repreive to consolidate sideways for maybe a month, even a rebound to mid 70s, which would likely to be rejected.”
A three-part call, and all three parts happened. His 27 February post has since rolled out of our 210-day price window, so the chart now anchors at the first covered close, $65,824 on 2 March, and the percentages here run from there. Bitcoin consolidated sideways for roughly a month, rebounded into the mid-70s — $74,679 on 17 March, +13.5% — and was rejected there, back to $65,947 (+0.2%) by 30 March. It later fell as far as $58,566 (−11.0%), then ran +31.6% to $86,597 on 22 September and holds $84,359 (+28.2%). The typo in “repreive” is his; we quote posts as written.
𝕏 Post@willywoo on X — 27 February 2026↗ x.com“BTC sold off WAY TOO FAST in this early bear market and current conditions are setting up to test mid-80s which is the cost basis of short term investors.”
Resolved — on his terms, but late. The framing was right: he said the rally was a bull trap and “NOT me saying the bottom is in”, and from $67,340 BTC rallied, rolled over and cut to $58,566 (−13.0%) on 1 July. The target took far longer than the setup implied. The May rally stalled at $82,018 (+21.8%), and the mid-80s short-term-holder cost basis he named was only tested on 22 September, at $86,597 (+28.6%) — six and a half months after the post, with a deeper low in between. Both halves have now happened, so we move this card from open to played out; price holds $84,359 (+25.3%).
Source‘Bull Trap Forming’ — Willy Woo Says Bottom Not In for Bitcoin (Bitcoin.com News, 9 Mar 2026)↗ news.bitcoin.com“I’d agree with this picture with the rejection at STH price which is 84k and dropping each day. Still weeks more in this mid bear consolidation.”
He named the level and the duration. BTC was $71,304; it was rejected immediately, down to $65,947 (−7.5%) in four days, and the “mid bear consolidation” ran for months rather than weeks. Through that whole stretch it never reached the 84k short-term-holder line he flagged as the ceiling — the summer high was $82,018 (+15.0%) on 11 May — before sliding to $58,566 (−17.9%) on 1 July. Bitcoin only closed above 84k on 22 September, six months later; it ran +21.4% to $86,597 and holds $84,359 (+18.3%). The call was about the spring, and on that horizon the level held.
𝕏 Post@willywoo on X — 26 March 2026↗ x.com“Old school onchain models suggest a BTC bottom between 46k-54k. Also hints at how much time we have to wait.”
His most specific number, and the one that has gone wrong. From $65,947 he was pointing 18–30% lower, with the CVDD floor model at 45.5k. Bitcoin never got there. The deepest close since is $58,566 on 1 July, −11.2% from his post and 8.5% above the top of his zone — and price has since run +31.3% to $86,597 and holds $84,359 (+27.9%). A fresh leg down could still validate it, but on 16 September Woo himself put 90% odds on the bottom already being in (last card below), which leaves this zone with few defenders.
𝕏 Post@willywoo on X — 30 March 2026↗ x.com“The next test for BTC is cleanly breaking the cost basis of recent investors (79k). I give it 30% odds on doing this on this attempt.”
A conditional call, and the condition failed the way he warned it might. BTC was $77,367. It did break 79k — the 30% branch — peaking at $82,018 (+6.0%) on 11 May. But he had added that a structural bottom only becomes likely “if BTC manages to hold this price level above $65K and not break down”, and that “the next 3-6 weeks will be telling”. It broke down: nine weeks later Bitcoin closed at $58,566, −24.3%. No structural bottom in that window, exactly as he framed it. Price has since run +11.9% to $86,597 and holds $84,359 (+9.0%).
𝕏 Post@willywoo on X — 28 April 2026↗ x.com“It's almost been a decade since the last time this happened... The last time BTC decoupled from stocks to this degree was 2015 (prelude to the 2017 bull market).”
The first constructive post of the whole window. BTC closed at $79,822, near the top of the range it broke into in late August — up from $69,291 on 20 August. Read the claim precisely: it is not a price target but a regime analogue, equities and Bitcoin pulling apart the way they did in 2015, which he labels the prelude to the 2017 bull market. Price dipped to $75,590 (−5.3%) on 16 September, then ran +8.5% to $86,597 on 22 September and holds $84,359 (+5.7%). That leans his way, but three weeks cannot settle a claim about a multi-year decoupling. It also sits awkwardly beside his own 46k–54k bottom call above, and we will not reconcile the two for him. Open until price picks a side for longer.
𝕏 Post@willywoo on X — 6 September 2026↗ x.com“I put the probability the bottom is in at 90%. We are in an early bull market structure based on long term investor liquidity returning.”
The turn, stated as a number. BTC closed at $75,590 that day, then ran +14.6% to $86,597 on 22 September and holds $84,359 (+11.6%). Read the claim precisely: it is not that $75k was the low, but that the cycle bottom is already behind the market — on this chart that is $58,566 on 1 July, 8.5% above the top of the 46k–54k zone he pointed to in March, which this post quietly retires. He gave no time frame and no invalidation level. As of 27 September price agrees with him; a close back under the July low would settle it against him. Open.
𝕏 Post@willywoo on X — 16 September 2026↗ x.comOs resultados são a nossa leitura da afirmação declarada face ao preço real da CoinGecko, não a pontuação dele. Os preços são fechos; «mínimo depois» é o fecho mais baixo entre a chamada e hoje. As marcas em aberto podem virar à medida que o ciclo se resolve — uma chamada de zona de fundo só está definitivamente errada quando o ciclo termina definitivamente.
Woo vende investigação, não sinais nem tokens — uma estrutura mais limpa do que a da maioria neste diretório. Ainda assim cria um incentivo que vale a pena nomear: uma carta paga sobre identificar o fundo do ciclo vale mais enquanto o fundo ainda estiver à frente.
Bitcoin Vector Lite no Substack é gratuita com um nível pago; os modelos de fluxo mais profundos ficam por trás dele. As subscrições são o negócio visível.
woobull.com e o rácio NVT são gratuitos há anos — funcionam como topo do funil e como a razão pela qual ele é citado de todo.
Esta é a divulgação que importa. Em maio de 2023 o Syz Group anunciou o SyzCrest Digital Uncorrelated, um fundo de cobertura cripto apoiado por um banco lançado com Woo e a CMCC Global, descrevendo-o como sócio-gerente da CMCC Global & Crest Fund, consultor do fundo Ama e sócio geral do S2F Fund; os perfis publicados listam também investimentos de fase seed em empresas cripto. Esses cargos vêm da imprensa de 2023 e não confirmámos quais continuam atuais. As posições não são divulgadas publicação a publicação, por isso trate qualquer chamada concreta como potencialmente alinhada com uma carteira que não consegue ver.
“BTC MOVES TO A 6-8 YEAR CYCLE? BTC has been locked into the gravity of a 4 year orbit... it was subject to strong internal forces of its halvening... a clockwork 4yr supply rate shock. Meanwhile TradFi is on a 6-8 year short term debt cycle.”
03 Sep 2026 · todo o seu enquadramento numa publicação“3 things happen at the end of bear markets. 1) price cleanly breaks the cost basis of recent investors (circles). 2) idle smoking of hopium gives way to rabid clicking of the BUY button chasing the price 3) this raises the cost basis (red line transitions to green)”
05 Apr 2026 · o horizonte longo por baixo do ano baixista“I could see a future where BTC trades sideways for 8-12 yrs remaining 5-6 figures, then 12-16 yrs out a god candle to multiple 7 figures.”
05 Apr 2026 · meio certo — a metade de alta falhou por 25%“I’m bullish BTC late Jan through Feb but presently bearish for 2026.”
11 Jan 2026 · half right — the bullish half missed by 25%Citações transcritas de seus próprios vídeos públicos; opiniões declaradas, não recomendações.
Woo publica por escrito, não em vídeo — gráficos Woobull e a carta semanal Bitcoin Vector Lite. O seu registo em vídeo são os podcasts de outras pessoas. Aparições representativas:
 Bitcoin Needs To Adapt Now | With Willy WooLook Into Bitcoin — gravado dias depois da chamada do fundo 46k–54k acima.10 Apr 2026
 The Bull Market, Institutional Adoption & 2026 Recession? | Willy WooWhat Bitcoin Did — onde enquadrou pela primeira vez 2026 como o verdadeiro teste do ciclo.26 Aug 2025
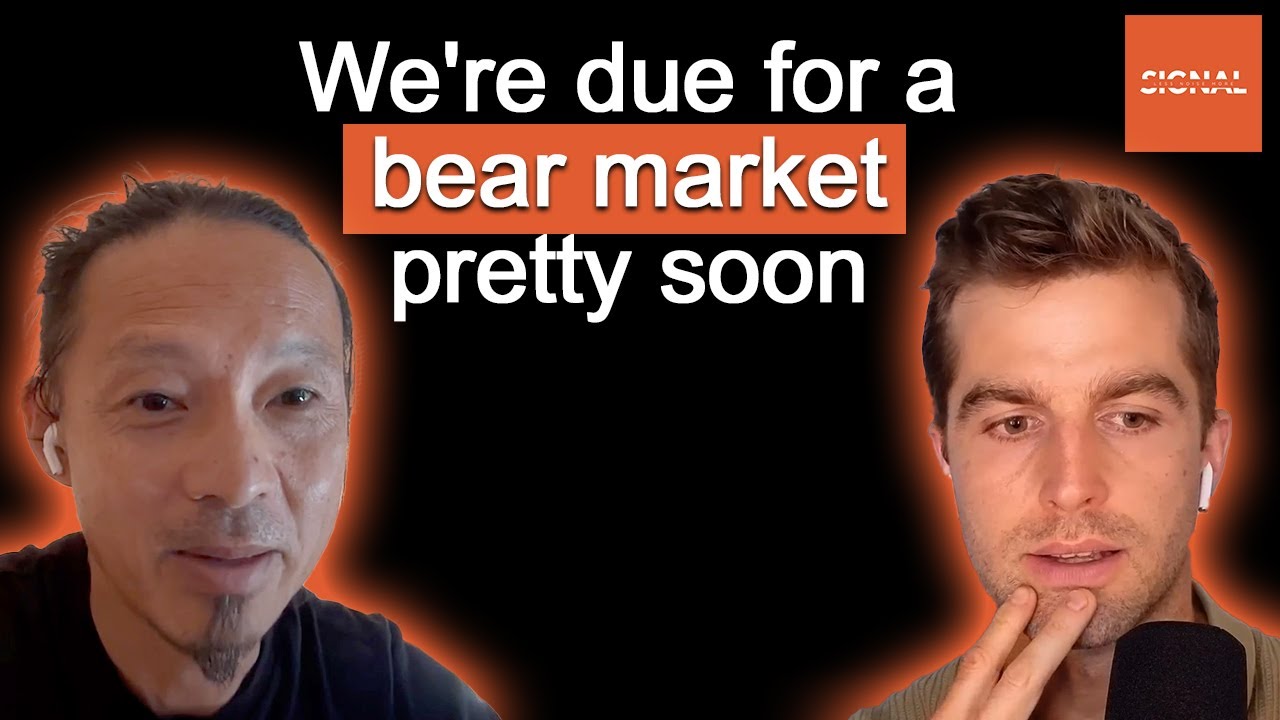 Trader legend Willy Woo: A 80% Bitcoin drawdown again is possibleLess Noise More Signal — o cenário de queda, seis meses antes de precisar dele.25 Sep 2025
 Bitcoin Whales Dumping As Liquidity Crisis Hits | Willy Woo Reveals The EndgameThe Wolf Of All Streets — com Scott Melker, cujo dossiê também está neste diretório.14 Sep 2025
Um analista on-chain de Bitcoin, mais conhecido por popularizar o rácio NVT — valor de rede a dividir pelo volume de transações, apresentado como «Bitcoin's P/E ratio» — e pela biblioteca de gráficos Woobull. Escreve a carta semanal Bitcoin Vector Lite no Substack e tem cerca de 1,1 M de seguidores no X, onde publica agora como @willywoo (antes @woonomic).
For most of 2026 he was bearish: his on-chain models pointed to a bottom between $46,000 and $54,000, with the CVDD floor near $45,500 when he said it in March. That zone has not printed — Bitcoin's lowest close since was $58,566 on 1 July. On 16 September 2026 he reversed, putting the probability that the bottom is in at 90% and calling the market an early bull structure. Separately, he has floated a much longer-horizon view of Bitcoin trading sideways for 8–12 years before a move to seven figures.
Misto, e o padrão é consistente: forte na direção, fraco na magnitude. Nesta janela a sua chamada de rejeição de fevereiro e o seu nível de resistência de março concretizaram-se com precisão, e a sua leitura de abril de que as peças para um fundo ainda não estavam no lugar foi validada por uma queda de 24%. Mas a sua zona de fundo de $46k–$54k nunca chegou, o seu alvo de 2021 de $250k–$300k falhou por um fator de cerca de quatro, e a sua publicação de janeiro de 2026 — «I'm bullish BTC late Jan through Feb but presently bearish for 2026» — pôs a metade otimista diretamente numa queda de 25%.
A métrica mais conhecida de Woo: o valor de rede do Bitcoin (capitalização) a dividir pelo valor em dólares transacionado na cadeia. Uma leitura alta sugere que o preço se adiantou ao uso económico da rede; uma leitura baixa sugere o contrário. Apresentou-a como o análogo on-chain do rácio preço/lucro de uma ação, e abriu a porta a todo o campo da análise on-chain.
Woo ignora a vela e segue o dinheiro — fluxos, custos base e a paciência para aguentar meses de lateralização. Quão perto está o seu instinto? Meça-o a sério com um Trader Passport.
Agora descubra o que compensa mesmo. Teste a sua vantagem com dados de mercado ao vivo — sem capital em risco — num torneio gratuito da BuyCrypt com prémios reais.
Análise informativa e educativa baseada estritamente em materiais públicos — as suas próprias publicações datadas no X (capturadas literalmente através do endpoint público de sindicação do X) e cobertura datada de terceiros, ligada em cada chamada. Não é aconselhamento financeiro ou de investimento. Os valores são aproximados e mudam constantemente. Spotted an error, or are you Willy? Envie uma correção →
Perfis verificados · Fontes citadas acima · Metodologia de avaliação · Atualizado 27 September 2026

















