
@willywoo
The analyst who made “on-chain” a category. Woo doesn't read candles — he reads where money actually moves: investor flows, realised prices, the cost basis of recent buyers. Through most of 2026 that model kept him bearish while the rest of crypto looked for a bottom, and the price mostly agreed with him. Where it didn't, it didn't by a wide margin — his 46k–54k bottom zone never printed. In September, with long-term liquidity returning, he turned: on 16 September he put 90% odds on the bottom being in.
En resumen. Willy Woo is one of the original Bitcoin on-chain analysts — creator of the NVT ratio (“Bitcoin's P/E”), publisher of the Woobull chart library, and author of the weekly Bitcoin Vector Lite letter on Substack. His framework is deliberately not technical analysis: he models investor liquidity flows and compares price against on-chain cost bases (short-term-holder price, realised price, the CVDD floor) to say where the market is in its cycle. For most of 2026 that model made him one of the most consistently bearish major voices — and, for the levels that mattered, largely right: he called the March rally a bull trap and it was rejected exactly where he said. He is also on record with targets that never arrived, from $250k in 2021 to a 46k–54k bottom this year — a zone he effectively retired in September, when he called the bottom in at 90% odds.
Woo llegó a los mercados desde el software: los perfiles publicados describen a un programador nacido en Hong Kong y criado en Nueva Zelanda que construyó y vendió startups antes de pasarse al trading, y que compró su primer bitcoin a finales de 2013. Lo que le dio nombre no fue una operación sino una métrica: en 2017 popularizó el ratio NVT, el valor de red dividido por el volumen de transacciones, presentado como «Bitcoin's P/E ratio». Fue la primera herramienta de valoración on-chain de uso masivo, y la biblioteca de gráficos Woobull que creció a su alrededor sigue siendo una referencia estándar. Hoy publica Bitcoin Vector Lite cada semana en Substack — «views into BTC's underlying structure through the lens of investor flows» — con un nivel de pago detrás.
The record cuts both ways and the misses are large. On 29 April 2021 he told SALT Talks that Bitcoin “could reach $250K to $300K by the end of that cycle”, later stretching it to $300K–$400K on institutional inflows; Bitcoin topped near $69,000 that November. In September 2025, with BTC just off a $124,457 record, he suggested it “could race up to $140,000–$160,000” — while adding he couldn't tell. It never did. And on 11 January 2026 he posted “I'm bullish BTC late Jan through Feb but presently bearish for 2026”: the bearish half aged well, the bullish half did not — Bitcoin fell from $89,212 on 29 January to $67,017 by 1 March, −25% straight through the window he was bullish on. That January post sits just outside the chart below; the seven calls that follow are all inside it.
Sources: x.com/willywoo (verified via X syndication) · woobull.com · willywoo.substack.com · Bitcoin.com News · Yahoo Finance
Primero los flujos, después el precio. La unidad de análisis de Woo es el capital, no la vela: cuánto dinero real entra o sale de Bitcoin y cómo se compara con el momentum de precio que se supone que debe sostener. Las herramientas recurrentes son costes base on-chain — el precio de los tenedores de corto plazo (el punto de equilibrio de quienes compraron en los últimos 155 días), el precio realizado y el suelo CVDD — más sus propios modelos de flujo de inversores y una mirada al riesgo cruzado (volatilidad de acciones, liquidez macro). Eso le da estructura y paciencia: puede decir «Still weeks more in this mid bear consolidation» y decirlo en serio. La debilidad es simétrica. Los modelos de flujo son buenos con el régimen (bajista o alcista) y malos con la magnitud: sus llamadas direccionales han aguantado mucho mejor que las cifras concretas que las acompañan.
Bearish on 2026 from January through the summer — his flow models had liquidity waning against price since January 2025. September is where that changed. On 6 September 2026 he flagged Bitcoin decoupling from equities as it did in 2015, and on 16 September he put the probability that the bottom is in at 90%, calling the market an early bull structure on returning long-term investor liquidity. His longer view is unchanged: Bitcoin in seven figures, but over a 12–16 year horizon.
Seven dated 2026 posts, charted against real price from the day he said them. Every quote below was pulled from X's own syndication endpoint or from the dated article that carries it — nothing is paraphrased. Woo trades in regimes and levels rather than one-line targets, so each card scores the specific claim he made: did the rejection happen where he said, did the level break, did the bottom print in the zone. He was right on the shape of the market in Feb–April and wrong on how deep it would go; the two newest cards, from September, are the first in this window pointing up — ending with his call that the bottom is in.
“This bearish sell down by investors seems to have exhausted, which gives price a repreive to consolidate sideways for maybe a month, even a rebound to mid 70s, which would likely to be rejected.”
A three-part call, and all three parts happened. His 27 February post has since rolled out of our 210-day price window, so the chart now anchors at the first covered close, $65,824 on 2 March, and the percentages here run from there. Bitcoin consolidated sideways for roughly a month, rebounded into the mid-70s — $74,679 on 17 March, +13.5% — and was rejected there, back to $65,947 (+0.2%) by 30 March. It later fell as far as $58,566 (−11.0%), then ran +31.6% to $86,597 on 22 September and holds $84,359 (+28.2%). The typo in “repreive” is his; we quote posts as written.
𝕏 Post@willywoo on X — 27 February 2026↗ x.com“BTC sold off WAY TOO FAST in this early bear market and current conditions are setting up to test mid-80s which is the cost basis of short term investors.”
Resolved — on his terms, but late. The framing was right: he said the rally was a bull trap and “NOT me saying the bottom is in”, and from $67,340 BTC rallied, rolled over and cut to $58,566 (−13.0%) on 1 July. The target took far longer than the setup implied. The May rally stalled at $82,018 (+21.8%), and the mid-80s short-term-holder cost basis he named was only tested on 22 September, at $86,597 (+28.6%) — six and a half months after the post, with a deeper low in between. Both halves have now happened, so we move this card from open to played out; price holds $84,359 (+25.3%).
Source‘Bull Trap Forming’ — Willy Woo Says Bottom Not In for Bitcoin (Bitcoin.com News, 9 Mar 2026)↗ news.bitcoin.com“I’d agree with this picture with the rejection at STH price which is 84k and dropping each day. Still weeks more in this mid bear consolidation.”
He named the level and the duration. BTC was $71,304; it was rejected immediately, down to $65,947 (−7.5%) in four days, and the “mid bear consolidation” ran for months rather than weeks. Through that whole stretch it never reached the 84k short-term-holder line he flagged as the ceiling — the summer high was $82,018 (+15.0%) on 11 May — before sliding to $58,566 (−17.9%) on 1 July. Bitcoin only closed above 84k on 22 September, six months later; it ran +21.4% to $86,597 and holds $84,359 (+18.3%). The call was about the spring, and on that horizon the level held.
𝕏 Post@willywoo on X — 26 March 2026↗ x.com“Old school onchain models suggest a BTC bottom between 46k-54k. Also hints at how much time we have to wait.”
His most specific number, and the one that has gone wrong. From $65,947 he was pointing 18–30% lower, with the CVDD floor model at 45.5k. Bitcoin never got there. The deepest close since is $58,566 on 1 July, −11.2% from his post and 8.5% above the top of his zone — and price has since run +31.3% to $86,597 and holds $84,359 (+27.9%). A fresh leg down could still validate it, but on 16 September Woo himself put 90% odds on the bottom already being in (last card below), which leaves this zone with few defenders.
𝕏 Post@willywoo on X — 30 March 2026↗ x.com“The next test for BTC is cleanly breaking the cost basis of recent investors (79k). I give it 30% odds on doing this on this attempt.”
A conditional call, and the condition failed the way he warned it might. BTC was $77,367. It did break 79k — the 30% branch — peaking at $82,018 (+6.0%) on 11 May. But he had added that a structural bottom only becomes likely “if BTC manages to hold this price level above $65K and not break down”, and that “the next 3-6 weeks will be telling”. It broke down: nine weeks later Bitcoin closed at $58,566, −24.3%. No structural bottom in that window, exactly as he framed it. Price has since run +11.9% to $86,597 and holds $84,359 (+9.0%).
𝕏 Post@willywoo on X — 28 April 2026↗ x.com“It's almost been a decade since the last time this happened... The last time BTC decoupled from stocks to this degree was 2015 (prelude to the 2017 bull market).”
The first constructive post of the whole window. BTC closed at $79,822, near the top of the range it broke into in late August — up from $69,291 on 20 August. Read the claim precisely: it is not a price target but a regime analogue, equities and Bitcoin pulling apart the way they did in 2015, which he labels the prelude to the 2017 bull market. Price dipped to $75,590 (−5.3%) on 16 September, then ran +8.5% to $86,597 on 22 September and holds $84,359 (+5.7%). That leans his way, but three weeks cannot settle a claim about a multi-year decoupling. It also sits awkwardly beside his own 46k–54k bottom call above, and we will not reconcile the two for him. Open until price picks a side for longer.
𝕏 Post@willywoo on X — 6 September 2026↗ x.com“I put the probability the bottom is in at 90%. We are in an early bull market structure based on long term investor liquidity returning.”
The turn, stated as a number. BTC closed at $75,590 that day, then ran +14.6% to $86,597 on 22 September and holds $84,359 (+11.6%). Read the claim precisely: it is not that $75k was the low, but that the cycle bottom is already behind the market — on this chart that is $58,566 on 1 July, 8.5% above the top of the 46k–54k zone he pointed to in March, which this post quietly retires. He gave no time frame and no invalidation level. As of 27 September price agrees with him; a close back under the July low would settle it against him. Open.
𝕏 Post@willywoo on X — 16 September 2026↗ x.comLos resultados son nuestra lectura de su afirmación declarada frente al precio real de CoinGecko, no su propia puntuación. Los precios son cierres; «mínimo posterior» es el cierre más bajo entre la llamada y hoy. Las marcas abiertas pueden cambiar según se resuelva el ciclo: una llamada de zona de suelo solo es definitivamente errónea cuando el ciclo termina definitivamente.
Woo vende investigación, no señales ni tokens, lo que es una estructura más limpia que la de la mayoría de este directorio. Aun así crea un incentivo que conviene nombrar: una carta de pago sobre identificar el suelo del ciclo vale más mientras el suelo siga por delante.
Bitcoin Vector Lite en Substack es gratuita con un nivel de pago; los modelos de flujo más profundos están detrás. Las suscripciones son el negocio visible.
woobull.com y el ratio NVT llevan años siendo gratuitos: funcionan como parte alta del embudo y como la razón por la que se le cita.
Esta es la divulgación que importa. En mayo de 2023 Syz Group anunció SyzCrest Digital Uncorrelated, un fondo de cobertura cripto respaldado por un banco lanzado con Woo y CMCC Global, describiéndolo como socio director de CMCC Global & Crest Fund, asesor del fondo Ama y socio general del S2F Fund; los perfiles publicados también listan inversiones semilla en empresas cripto. Esos cargos provienen de prensa de 2023 y no hemos confirmado cuáles siguen vigentes. Las posiciones no se declaran publicación a publicación, así que trate cualquier llamada concreta como potencialmente alineada con una cartera que usted no ve.
“BTC MOVES TO A 6-8 YEAR CYCLE? BTC has been locked into the gravity of a 4 year orbit... it was subject to strong internal forces of its halvening... a clockwork 4yr supply rate shock. Meanwhile TradFi is on a 6-8 year short term debt cycle.”
03 Sep 2026 · todo su marco en una publicación“3 things happen at the end of bear markets. 1) price cleanly breaks the cost basis of recent investors (circles). 2) idle smoking of hopium gives way to rabid clicking of the BUY button chasing the price 3) this raises the cost basis (red line transitions to green)”
05 Apr 2026 · el horizonte largo bajo el año bajista“I could see a future where BTC trades sideways for 8-12 yrs remaining 5-6 figures, then 12-16 yrs out a god candle to multiple 7 figures.”
05 Apr 2026 · medio acierto — la mitad alcista falló por 25%“I’m bullish BTC late Jan through Feb but presently bearish for 2026.”
11 Jan 2026 · half right — the bullish half missed by 25%Citas transcritas de sus propios videos públicos; opiniones expresadas, no recomendaciones.
Woo publica por escrito, no ante la cámara: los gráficos de Woobull y la carta semanal Bitcoin Vector Lite. Su registro en vídeo son los pódcast de otros. Apariciones representativas:
 Bitcoin Needs To Adapt Now | With Willy WooLook Into Bitcoin — grabado días después de la llamada del suelo 46k–54k de arriba.10 Apr 2026
 The Bull Market, Institutional Adoption & 2026 Recession? | Willy WooWhat Bitcoin Did — donde planteó por primera vez 2026 como la prueba real del ciclo.26 Aug 2025
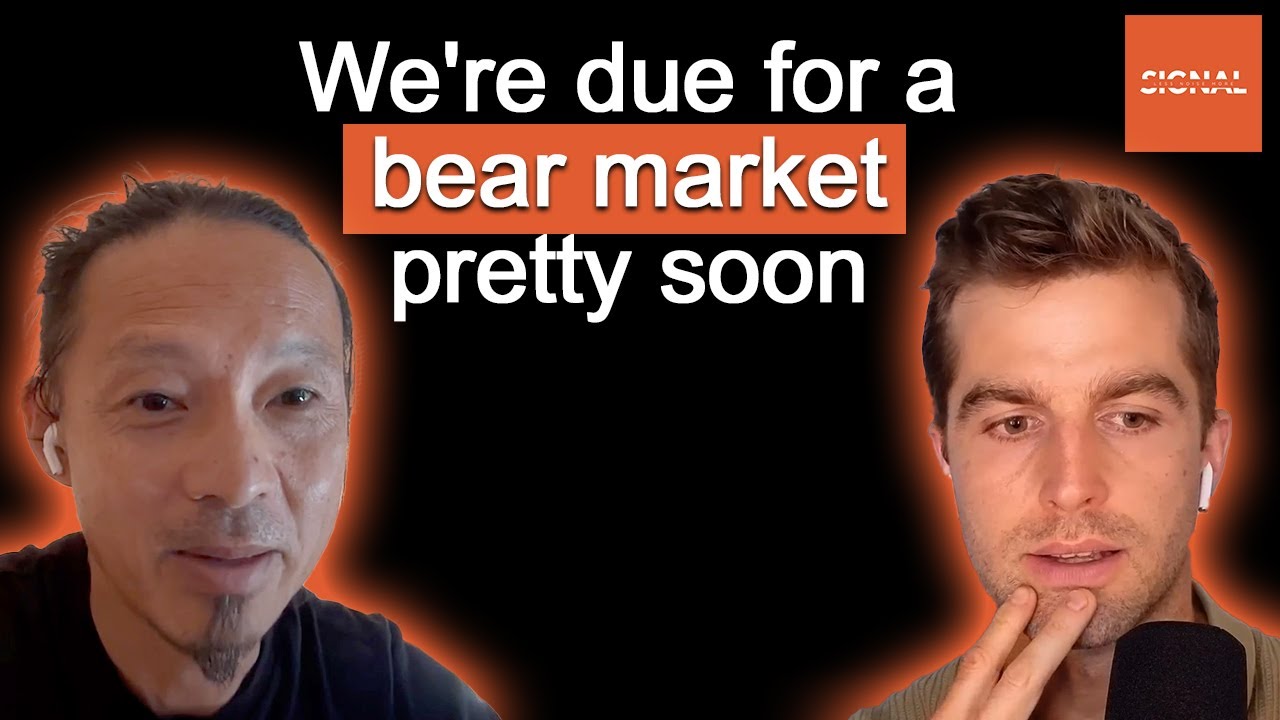 Trader legend Willy Woo: A 80% Bitcoin drawdown again is possibleLess Noise More Signal — el escenario bajista, seis meses antes de necesitarlo.25 Sep 2025
 Bitcoin Whales Dumping As Liquidity Crisis Hits | Willy Woo Reveals The EndgameThe Wolf Of All Streets — con Scott Melker, cuyo dosier también está en este directorio.14 Sep 2025
Un analista on-chain de Bitcoin, conocido sobre todo por popularizar el ratio NVT — valor de red dividido por volumen de transacciones, presentado como «Bitcoin's P/E ratio» — y por la biblioteca de gráficos Woobull. Escribe la carta semanal Bitcoin Vector Lite en Substack y tiene alrededor de 1,1 M de seguidores en X, donde ahora publica como @willywoo (antes @woonomic).
For most of 2026 he was bearish: his on-chain models pointed to a bottom between $46,000 and $54,000, with the CVDD floor near $45,500 when he said it in March. That zone has not printed — Bitcoin's lowest close since was $58,566 on 1 July. On 16 September 2026 he reversed, putting the probability that the bottom is in at 90% and calling the market an early bull structure. Separately, he has floated a much longer-horizon view of Bitcoin trading sideways for 8–12 years before a move to seven figures.
Mixto, y el patrón es consistente: fuerte en dirección, débil en magnitud. En esta ventana su llamada de rechazo de febrero y su nivel de resistencia de marzo se cumplieron con precisión, y su lectura de abril de que las piezas para un suelo aún no estaban en su sitio quedó validada por una caída del 24%. Pero su zona de suelo de $46k–$54k nunca llegó, su objetivo de 2021 de $250k–$300k falló por un factor de unas cuatro veces, y su publicación de enero de 2026 — «I'm bullish BTC late Jan through Feb but presently bearish for 2026» — metió la mitad alcista directamente en una caída del 25%.
La métrica más conocida de Woo: el valor de red de Bitcoin (capitalización) dividido por el valor en dólares transaccionado en la cadena. Una lectura alta sugiere que el precio se ha adelantado al uso económico de la red; una baja, lo contrario. Lo presentó como el análogo on-chain del PER de una acción, y abrió la puerta a todo el campo de la analítica on-chain.
Woo ignora la vela y sigue el dinero: flujos, costes base y la paciencia de aguantar meses de lateral. ¿Cuánto se parece tu instinto? Mídelo de verdad con un Trader Passport.
Ahora descubre cuál compensa de verdad. Pon a prueba tu ventaja con datos de mercado en vivo — sin capital en riesgo — en un torneo gratuito de BuyCrypt con premios reales.
Análisis informativo y educativo basado estrictamente en materiales públicos: sus propias publicaciones fechadas en X (capturadas literalmente desde el endpoint público de sindicación de X) y cobertura fechada de terceros, enlazada en cada llamada. No es asesoramiento financiero ni de inversión. Las cifras son aproximadas y cambian constantemente. Spotted an error, or are you Willy? Enviar una corrección →
Cuentas verificadas · Fuentes citadas arriba · Metodología de puntuación · Actualizado 27 September 2026

















