
@KevinSvenson_
A chart trader who puts a number on almost every setup — a 🎯 target, a Fibonacci level, a bottom zone — and posts it with a date. That makes him easy to grade. In 2026 his bullish reversal calls landed: a $79,500 squeeze target in April and a cycle-low call at $59K in June. His March call for a bottom around $50K got the direction right but the level wrong. In October his 48-hour breakout calls for $92K Bitcoin and $3,200 Ethereum missed, and his September ETH and “bear market is over” calls are still open.
En resumen. Kevin Svenson posts Bitcoin and Ethereum chart analysis to about 163,000 followers on X and runs the Kevin Svenson Crypto YouTube channel. His bio lists him as CTO of AltvsBtc.com. On our sample of seven in-window posts the record is 2 played out, 3 open, 2 went against. On 15 April he targeted $79,500 from $74,297, and Bitcoin closed above it on 5 May. On 29 June, at $59,495, he said the setup “has marked every major cycle low” — Bitcoin dipped only 1.6% further and is up 37.4% since. His 26 March call for “1 more leg down” to a bottom around $50K is graded open-mixed: the leg down came, but the low was $58,566, nowhere near $50K. On 3 October he gave Bitcoin $92,000 and Ethereum $3,200 within “the next 48 hours”; neither broke out, and both are below their call prices. Outside this chart window, his 2025 top call of $140,000–$150,000 missed (Bitcoin peaked near $126K).
Svenson publica como @KevinSvenson_ en X, donde su feed son sobre todo gráficos diarios y semanales de Bitcoin, Ethereum e índices de altcoins, cada uno con el nombre del patrón y un objetivo. También dirige el canal de YouTube Kevin Svenson Crypto; Daily Hodl lo situó en unos 83,900 suscriptores en septiembre de 2025. Sus vídeos son largas «sesiones de estrategia» sobre la estructura del ciclo, la dominancia de Bitcoin y las altseasons. Su biografía de X lo presenta como CTO de AltvsBtc.com, un sitio que grafica altcoins frente a Bitcoin, y enlaza otros dos productos, agent4663.tech y TokenTicker.app, además de un enlace de referido de un exchange. No encontramos registro público de su país, edad ni trayectoria previa, así que esta página no los indica.
También tiene un fallo documentado que queda fuera de esta ventana del gráfico. En julio de 2025 dijo a sus espectadores que Bitcoin entraba en la «fase vertical» y estimó «$140,000 – $150,000» como la siguiente zona de techo, «quizá hacia octubre». En septiembre de 2025 repitió $140,000–$150,000 con un techo hacia noviembre-enero. Bitcoin tocó techo cerca de $126,000 en octubre de 2025 y después cayó en el mercado bajista de 2026. Su sincronización del pico fue cercana; su nivel, no. Los pronombres de esta página siguen el uso de la prensa (Daily Hodl escribe «he»); él no los ha indicado.
Sources: x.com/KevinSvenson_ (captured via api.fxtwitter.com and X syndication) · YouTube channel UCVTbGN6Hzi4sSAz1bKHiDiQ · dailyhodl.com coverage (2025)
Classical chart patterns with explicit targets. He names the pattern (continuation, short-squeeze setup, rejection candles), marks the trigger, and posts a 🎯 target, often tied to a Fibonacci extension such as the 1.272. On longer timeframes he leans on cycle analogies — parabolic-curve bases, “every major cycle low for 15 years” — and sentiment extremes. The strength is that his calls are falsifiable: a number and a date. The weakness shows on cycle-scale levels: the $50K bottom and the 2025 $140,000–$150,000 top were both off by well over 10%, even when the direction was right. Short windows cut both ways too: his October 48-hour breakout calls for Bitcoin and Ethereum missed.
Bullish since the summer low. He called the cycle low on 29 June and declared the bear market over on 21 September. In this sample his only bearish call was the March “1 more leg down”, which he framed as the last drop before a year of accumulation. He stayed bullish into October, calling $92K Bitcoin on 3 and 6 October and saying on 12 October the weekly close was “in the bulls favor now”.
Seven dated posts from @KevinSvenson_, each captured verbatim from X and charted against real price. The tally is 2 played out, 3 open, 2 went against. The wins are the $79,500 squeeze target in April and the cycle-low call at $59,495 in June. The misses are his 3 October 48-hour breakout calls: $92,000 Bitcoin and $3,200 Ethereum. His March call for a $50K bottom is graded open-mixed: the leg down happened, the level did not. The September ETH target and the “bear market is officially over” call are still open, and both are back near or below their call prices.
“A push through local highs puts $92K in play. The chart says breakout in the next 48 hours.”
A “next daily target” of $92,000, about +8.9% above Bitcoin's $84,506 mark that day, with a 48-hour window for the breakout. Bitcoin's best mark after the post was $86,490 (+2.3%) on 5 October, still under the 22 September local high of $86,597. He repeated “$92,000 🎯 on next leg up” on 6 October, at $85,771. The breakout did not come: Bitcoin fell to $81,408 (−3.7%) and sits at $81,764 (−3.2%), with $92K still 12.5% away. On daily marks the 48 hours passed without the breakout, so we grade it went against.
𝕏 Post“$92,000 #Bitcoin 🟠 next daily target 🎯” — @KevinSvenson_ on X↗ x.com“A break of local highs puts $3,200 in play. Same window as Bitcoin: the next 48 hours decide.”
The Ethereum half of the same thread: a break of local highs would put $3,200 in play, about +19.9% above ETH's $2,668 mark, within the same 48 hours. ETH peaked at $2,726 (+2.2%) on 5 October, below its 22 September high of $2,775. It then dropped to $2,400 (−10.0%) and sits at $2,418 (−9.4%). The 48 hours passed without the break, and price fell — went against.
𝕏 Post“#Ethereum🔹 is tracking the same daily structure.” — @KevinSvenson_ on X↗ x.com“The bear market is officially over.”
A regime call, posted with “bull market loading” for Bitcoin, Ethereum and altcoins. Bitcoin was at $81,169, and that day's mark is still the floor: it has not closed lower since. It ran to $86,597 (+6.7%) the next day, but gave it all back: the lowest mark since is $81,408 on 18 October, and Bitcoin sits at $81,764 (+0.7%). Four weeks on it is flat, not a bull market yet, and not a new low either — open.
𝕏 Post“The bear market is officially over.” — @KevinSvenson_ on X↗ x.com“#ETHEREUM 🔷 Daily Chart Continuation pattern 🎯 Target = $3,380”
A daily-chart continuation pattern with a $3,380 target, about +36% above Ethereum's $2,485 mark that day. So far ETH dipped to $2,397 (−3.5%), then rose to $2,775 (+11.7%) on 22 September, but has slid back to $2,418 (−2.7%), below the call price. The target is now 39.8% away. Still open, but leaning against him.
𝕏 Post“#ETHEREUM 🔷 Daily Chart Continuation pattern 🎯 Target = $3,380” — @KevinSvenson_ on X↗ x.com“This exact setup has marked every major cycle low for $BTC for the last 15 years. It's time to start betting against the crowd”
With Bitcoin at $59,495, in “Extreme Fear” and below its two-year cost basis, he called a cycle-low setup and said to bet against the crowd. It was within a whisker of the bottom: Bitcoin dipped only −1.6% to $58,566 on 1 July, its 2026 low, then ran to $86,597 (+45.6%). It sits at $81,764 (+37.4%). Played out.
𝕏 Post“This exact setup has marked every major cycle low” — @KevinSvenson_ on X↗ x.com“If we reclaim and confirm price action above yesterday’s wick high, a trapped liquidity short squeeze initiates. Targeting 🎯 $79,500 (coincides with 1.272 Fib)”
Una configuración condicional de short squeeze desde $74,297, con un objetivo de $79,500 (alrededor de +7%). Bitcoin bajó a $73,841 el 20 de abril, luego cerró por encima del objetivo en $79,826 el 5 de mayo y tocó máximos en $82,018 el 11 de mayo. El squeeze no duró: Bitcoin cayó a $58,566 (−21.2%) para el 1 de julio. El objetivo se alcanzó — cumplida.
𝕏 Post“Targeting 🎯 $79,500 (coincides with 1.272 Fib)” — @KevinSvenson_ on X↗ x.com“1 more leg down seems about right. Then a bottom will form around $50K, we exit the downtrend, and we enter general accumulation for the rest of the year.”
From $71,304 he expected one more leg down to a bottom around $50K. Bitcoin first rallied to $82,018 on 11 May, then made that leg down to $58,566 (−17.9%) on 1 July, and has recovered to $81,764 (+14.7%). The shape he described happened — a final drop, then a turn — but the floor came in $8,566 above el nivel señalado. Bitcoin never got near $50K. We grade it mixed: direction right, level wrong.
𝕏 Post“Then a bottom will form around $50K” — @KevinSvenson_ on X↗ x.comLos resultados son nuestra lectura de su afirmación frente al precio real, no su propia puntuación. Cada cita es una publicación literal de X, enlazada en su tarjeta y reproducida íntegramente en el corpus verificado. Los precios son marcas diarias de CoinGecko, por lo que una publicación intradía se mide desde la marca de ese día, y una mecha que atraviese un nivel puede no aparecer. La línea «$1,000 in on their call» de esta página es comprar y mantener desde la fecha de la predicción; no modela posiciones cortas. Su predicción de techo de 2025 de $140,000–$150,000 queda fuera de la ventana de precios y no está graficada, pero se describe en el contexto. Las calificaciones de corto plazo pueden cambiar a medida que se resuelve el ciclo.
Svenson's business mixes content with products and an exchange partnership. None of it is hidden — it is in his X bio and his own posts — but it is worth knowing before you act on a chart.
Su biografía de X y muchas de sus publicaciones de gráficos incluyen un enlace de socio de BloFin (partner.blofin.com/d/KevinSvenson), y su canal de YouTube tiene un tutorial de BloFin sobre spot y futuros. Los enlaces de referido suelen pagar a quien los publica una parte de las comisiones de trading de quienes se registran, y operar futuros genera más comisiones que mantener.
Su biografía lo presenta como CTO de AltvsBtc.com y enlaza TokenTicker.app y agent4663.tech. Los promociona en sus publicaciones; por ejemplo, el 28 de septiembre presentó TokenTicker como la forma más fácil de ver qué tickers se están moviendo. No encontramos precios públicos para ellos.
He also launches crypto tokens. On 26 August he posted “I launched a meme coin that airdrops $NVDA, $TSLA, $AMZN, $AAPL, and $SPY stock tokens simply by holding the token” — $StonkATM, on Robinhood Chain, which charges traders a fee when they sell. On 28 September he posted that “$TICKER holders will get access to paid features post graduation”, linking a Pons launchpad page, and his feed reposts other Pons launchpad tokens. A launcher can gain when his audience buys; we found no public disclosure of what he holds.
El canal Kevin Svenson Crypto gana con las visualizaciones y con posibles patrocinios. Los títulos alcistas y enérgicos («The Bull Market Starts NOW?!») tienden a atraer más visualizaciones, un incentivo general que conviene tener en cuenta.
“This exact setup has marked every major cycle low for $BTC for the last 15 years. It's time to start betting against the crowd”
29 Jun 2026 · la predicción de mínimo de ciclo que se sostuvo“Then a bottom will form around $50K”
26 Mar 2026 · el nivel que nunca llegó“The bear market is officially over.”
21 Sep 2026 · la predicción de régimen aún abiertaCitas tomadas de sus propias fuentes públicas; son opiniones expresadas, no recomendaciones.
Svenson publica largas sesiones de gráficos en su canal de YouTube Kevin Svenson Crypto. Vídeos recientes representativos:
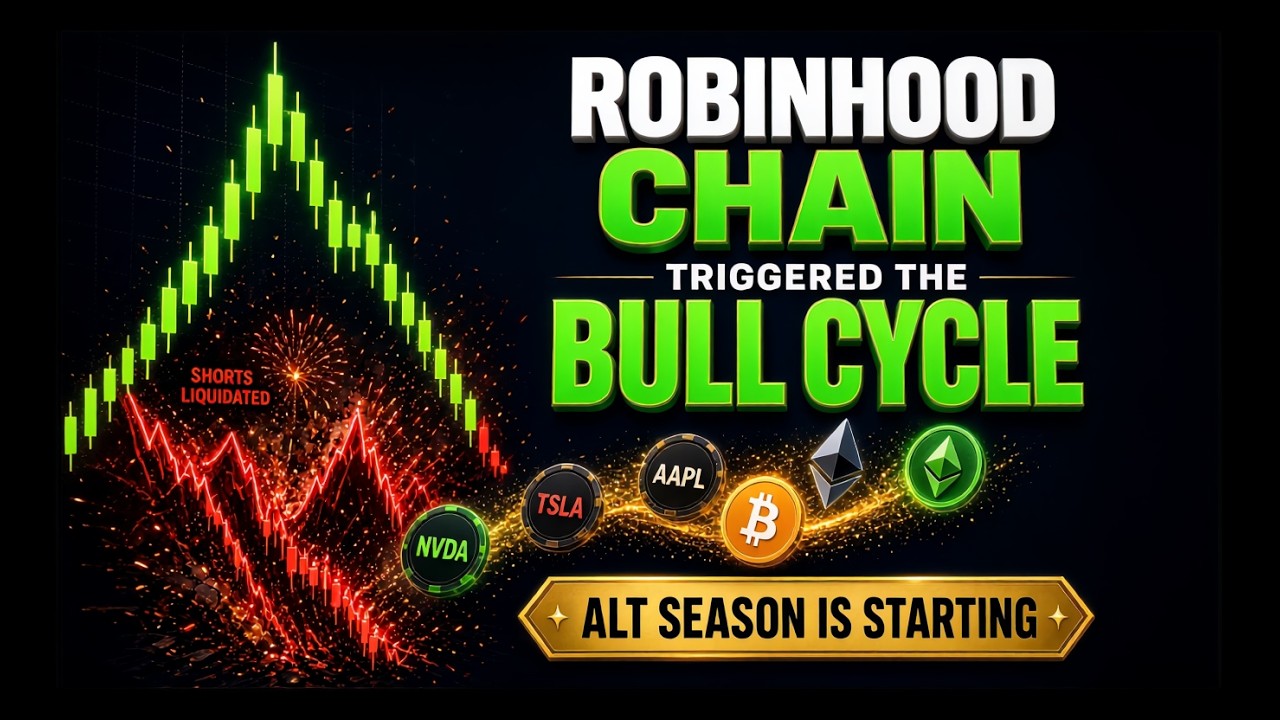 Robinhood Chain Triggered the Next Bull Cycle — Alt Season Is Here #Bitcoin #Ethereum #RobinhoodSus argumentos de que el ciclo de altcoins ha comenzado.11 Sep 2026
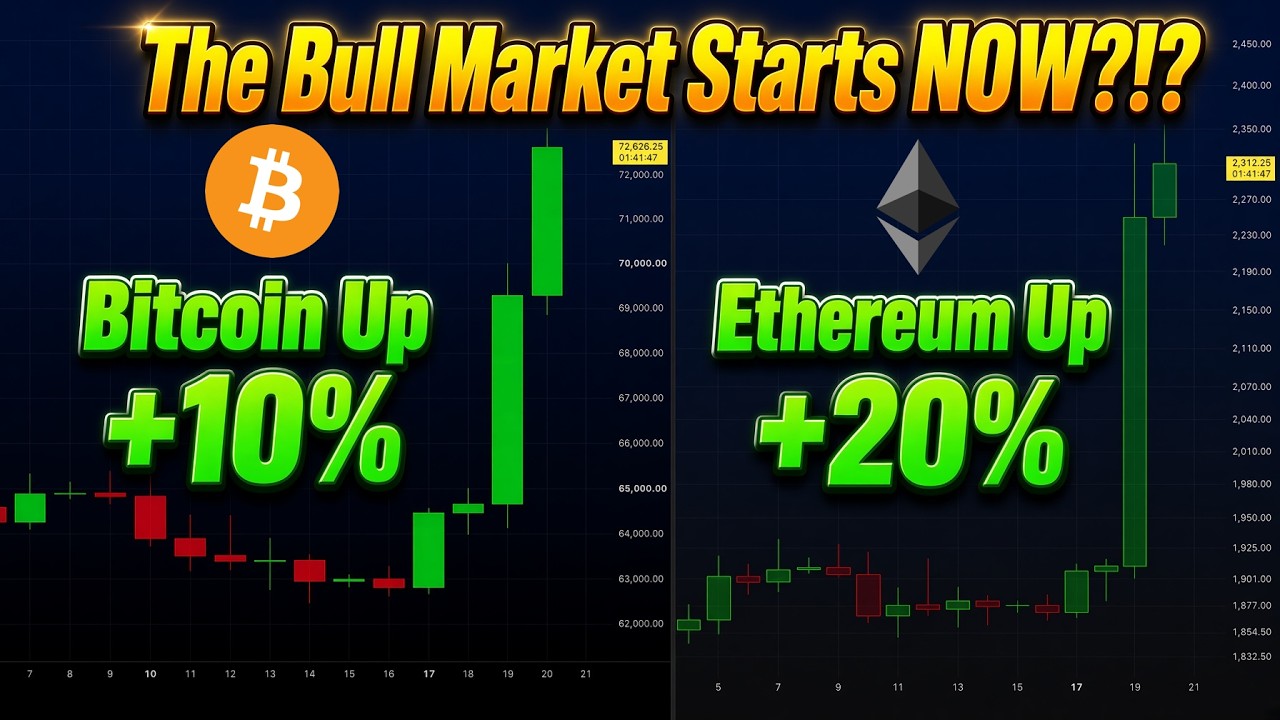 #Bitcoin +10% & #Ethereum +20% – The Bull Market Starts NOW?!El rally de agosto, interpretado como el inicio de un tramo alcista.20 Aug 2026
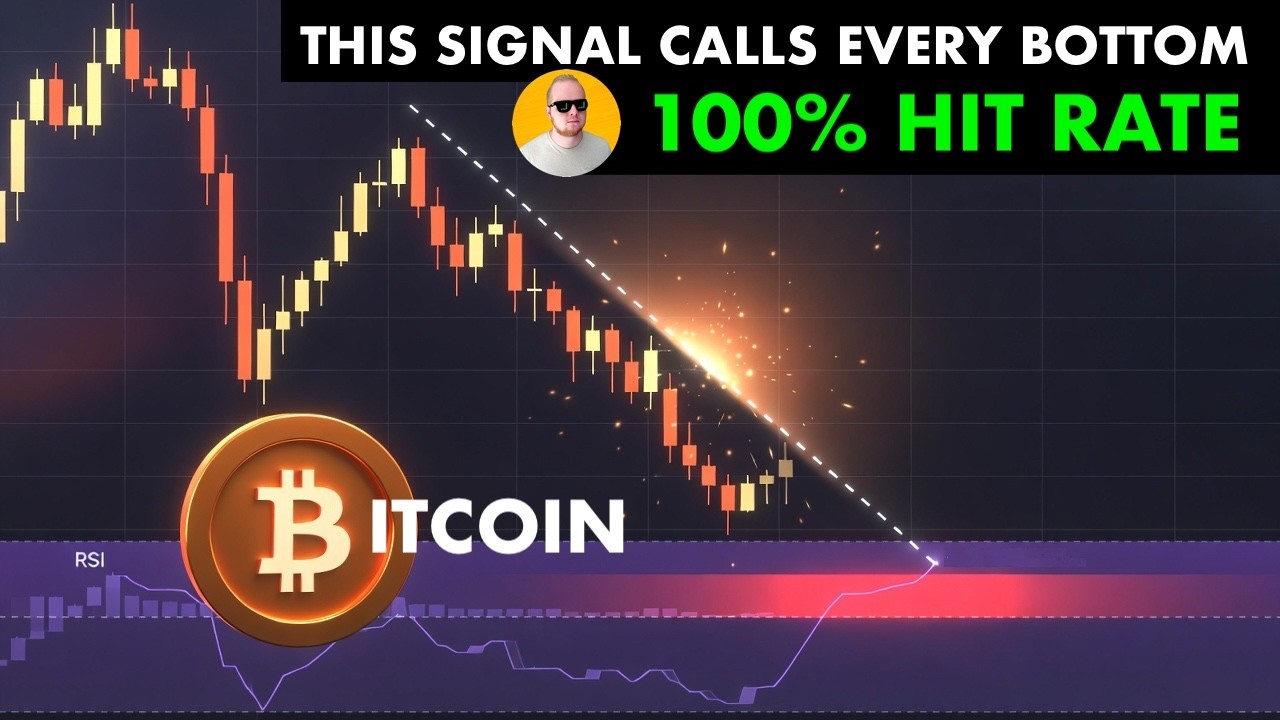 This #Bitcoin Bottom Signal Has NEVER Been WrongLa señal de mínimo de ciclo detrás de su predicción del 29 de junio.3 Jul 2026
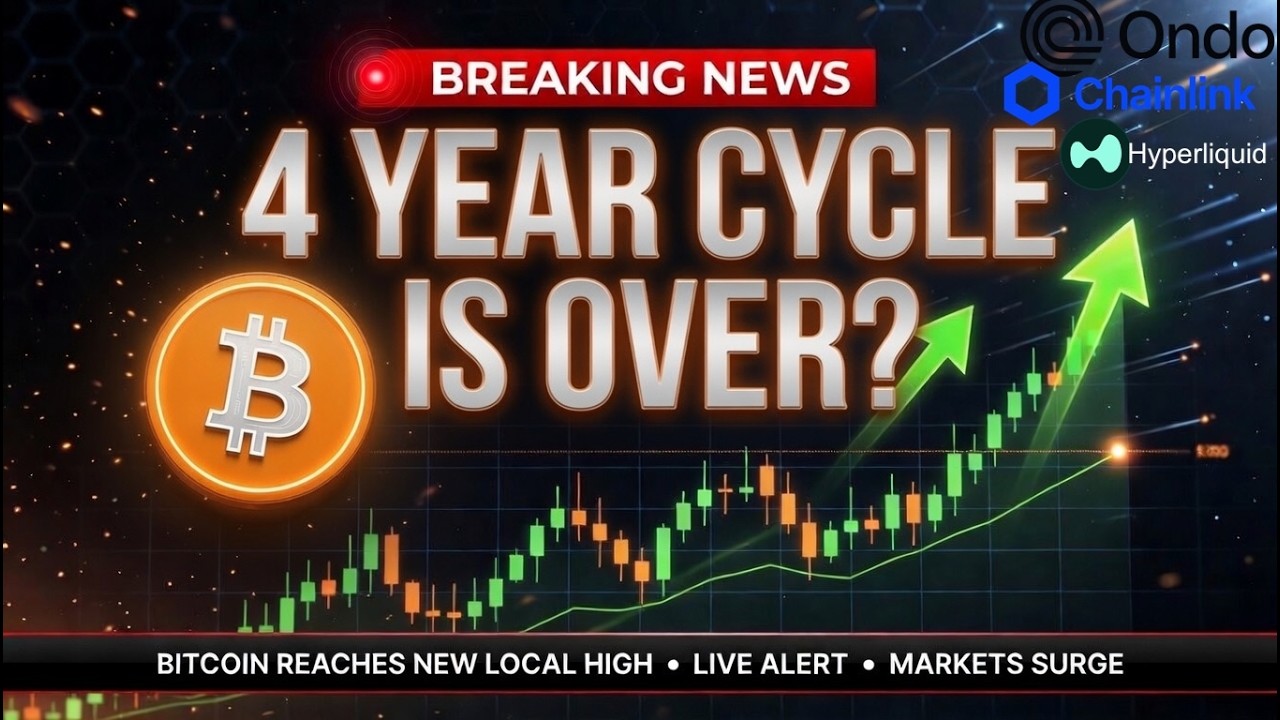 BIG SHIFT COMING FOR #BITCOIN #STOCKS $ALTS $ONDO $LINK $HYPEVisión entre mercados cerca de los máximos de mayo.8 May 2026
Un analista de gráficos cripto que publica configuraciones de Bitcoin y Ethereum con objetivos explícitos para unos 163,000 seguidores en X (@KevinSvenson_) y dirige el canal de YouTube Kevin Svenson Crypto. Su biografía de X lo presenta como CTO de AltvsBtc.com.
On our sample of seven dated 2026 posts: two played out, three are open, two went against. His April $79,500 target was hit on 5 May, and his 29 June cycle-low call came within 1.6% of the 2026 low. His 3 October calls for $92,000 Bitcoin and $3,200 Ethereum within 48 hours missed. His March call for a bottom around $50K missed the level (the low was $58,566), and his 2025 top target of $140,000–$150,000 missed (Bitcoin peaked near $126,000).
Indirectly. His posts and bio carry a BloFin exchange referral link, he promotes his own products (AltvsBtc.com, TokenTicker.app), he has launched his own tokens ($StonkATM in August 2026), and he earns from YouTube. We found no paid signal group.
Classical chart patterns with a trigger and a 🎯 target, often a Fibonacci extension, plus cycle analogies and sentiment extremes for the bigger picture. His record on near-term targets is mixed: two hits (April and June) and two 48-hour misses (October). His cycle-scale levels have been further off.
Svenson opera el patrón y publica la cifra. ¿Qué tan cerca está tu instinto? Mídelo de verdad con un Trader Passport.
Ahora pon a prueba tu enfoque. Mide tu ventaja con datos de mercado en vivo y sin arriesgar capital en un torneo gratuito de BuyCrypt con premios reales.
Análisis informativo y educativo basado estrictamente en materiales públicos: publicaciones fechadas de X capturadas desde los endpoints públicos de X y las fuentes enlazadas en cada predicción. No constituye asesoramiento financiero ni de inversión. Las cifras son aproximadas y cambian constantemente. Spotted an error, or are you Kevin? Enviar una corrección →
Cuentas verificadas · Fuentes citadas arriba · Metodología de puntuación · Actualizado 18 October 2026