
@KevinSvenson_
A chart trader who puts a number on almost every setup — a 🎯 target, a Fibonacci level, a bottom zone — and posts it with a date. That makes him easy to grade. In 2026 his bullish reversal calls landed: a $79,500 squeeze target in April and a cycle-low call at $59K in June. His March call for a bottom around $50K got the direction right but the level wrong. In October his 48-hour breakout calls for $92K Bitcoin and $3,200 Ethereum missed, and his September ETH and “bear market is over” calls are still open.
Kurz gesagt. Kevin Svenson posts Bitcoin and Ethereum chart analysis to about 163,000 followers on X and runs the Kevin Svenson Crypto YouTube channel. His bio lists him as CTO of AltvsBtc.com. On our sample of seven in-window posts the record is 2 played out, 3 open, 2 went against. On 15 April he targeted $79,500 from $74,297, and Bitcoin closed above it on 5 May. On 29 June, at $59,495, he said the setup “has marked every major cycle low” — Bitcoin dipped only 1.6% further and is up 37.4% since. His 26 March call for “1 more leg down” to a bottom around $50K is graded open-mixed: the leg down came, but the low was $58,566, nowhere near $50K. On 3 October he gave Bitcoin $92,000 and Ethereum $3,200 within “the next 48 hours”; neither broke out, and both are below their call prices. Outside this chart window, his 2025 top call of $140,000–$150,000 missed (Bitcoin peaked near $126K).
Svenson postet auf X als @KevinSvenson_; sein Feed besteht überwiegend aus Tages- und Wochencharts von Bitcoin, Ethereum und Altcoin-Indizes, jeweils mit Musterbezeichnung und Ziel. Außerdem betreibt er den YouTube-Kanal Kevin Svenson Crypto; Daily Hodl bezifferte ihn im September 2025 auf rund 83,900 Abonnenten. Seine Uploads sind lange „Strategie-Sessions“ über Zyklusstruktur, Bitcoin-Dominanz und Altseasons. Seine X-Bio führt ihn als CTO von AltvsBtc.com, einer Seite, die Altcoins gegen Bitcoin abbildet, und verlinkt zwei weitere Produkte, agent4663.tech und TokenTicker.app, sowie einen Börsen-Empfehlungslink. Wir fanden keine öffentlichen Angaben zu seinem Land, Alter oder früheren Werdegang, daher nennt diese Seite sie nicht.
Er hat außerdem einen dokumentierten Fehlgriff außerhalb dieses Chartfensters. Im Juli 2025 sagte er seinen Zuschauern, Bitcoin trete in die „vertikale Phase“ ein, und schätzte „$140,000 – $150,000“ als nächste Top-Zone, „vielleicht um Oktober“. Im September 2025 wiederholte er $140,000–$150,000 mit einem Top etwa zwischen November und Januar. Bitcoin erreichte im Oktober 2025 seinen Höchststand nahe $126,000 und fiel dann in den Bärenmarkt von 2026. Beim Timing des Hochs lag er nah dran, beim Level nicht. Die Pronomen auf dieser Seite folgen dem Sprachgebrauch der Presse (Daily Hodl schreibt „he“); er selbst hat sie nicht angegeben.
Sources: x.com/KevinSvenson_ (captured via api.fxtwitter.com and X syndication) · YouTube channel UCVTbGN6Hzi4sSAz1bKHiDiQ · dailyhodl.com coverage (2025)
Classical chart patterns with explicit targets. He names the pattern (continuation, short-squeeze setup, rejection candles), marks the trigger, and posts a 🎯 target, often tied to a Fibonacci extension such as the 1.272. On longer timeframes he leans on cycle analogies — parabolic-curve bases, “every major cycle low for 15 years” — and sentiment extremes. The strength is that his calls are falsifiable: a number and a date. The weakness shows on cycle-scale levels: the $50K bottom and the 2025 $140,000–$150,000 top were both off by well over 10%, even when the direction was right. Short windows cut both ways too: his October 48-hour breakout calls for Bitcoin and Ethereum missed.
Bullish since the summer low. He called the cycle low on 29 June and declared the bear market over on 21 September. In this sample his only bearish call was the March “1 more leg down”, which he framed as the last drop before a year of accumulation. He stayed bullish into October, calling $92K Bitcoin on 3 and 6 October and saying on 12 October the weekly close was “in the bulls favor now”.
Seven dated posts from @KevinSvenson_, each captured verbatim from X and charted against real price. The tally is 2 played out, 3 open, 2 went against. The wins are the $79,500 squeeze target in April and the cycle-low call at $59,495 in June. The misses are his 3 October 48-hour breakout calls: $92,000 Bitcoin and $3,200 Ethereum. His March call for a $50K bottom is graded open-mixed: the leg down happened, the level did not. The September ETH target and the “bear market is officially over” call are still open, and both are back near or below their call prices.
“A push through local highs puts $92K in play. The chart says breakout in the next 48 hours.”
A “next daily target” of $92,000, about +8.9% above Bitcoin's $84,506 mark that day, with a 48-hour window for the breakout. Bitcoin's best mark after the post was $86,490 (+2.3%) on 5 October, still under the 22 September local high of $86,597. He repeated “$92,000 🎯 on next leg up” on 6 October, at $85,771. The breakout did not come: Bitcoin fell to $81,408 (−3.7%) and sits at $81,764 (−3.2%), with $92K still 12.5% away. On daily marks the 48 hours passed without the breakout, so we grade it went against.
𝕏 Post“$92,000 #Bitcoin 🟠 next daily target 🎯” — @KevinSvenson_ on X↗ x.com“A break of local highs puts $3,200 in play. Same window as Bitcoin: the next 48 hours decide.”
The Ethereum half of the same thread: a break of local highs would put $3,200 in play, about +19.9% above ETH's $2,668 mark, within the same 48 hours. ETH peaked at $2,726 (+2.2%) on 5 October, below its 22 September high of $2,775. It then dropped to $2,400 (−10.0%) and sits at $2,418 (−9.4%). The 48 hours passed without the break, and price fell — went against.
𝕏 Post“#Ethereum🔹 is tracking the same daily structure.” — @KevinSvenson_ on X↗ x.com“The bear market is officially over.”
A regime call, posted with “bull market loading” for Bitcoin, Ethereum and altcoins. Bitcoin was at $81,169, and that day's mark is still the floor: it has not closed lower since. It ran to $86,597 (+6.7%) the next day, but gave it all back: the lowest mark since is $81,408 on 18 October, and Bitcoin sits at $81,764 (+0.7%). Four weeks on it is flat, not a bull market yet, and not a new low either — open.
𝕏 Post“The bear market is officially over.” — @KevinSvenson_ on X↗ x.com“#ETHEREUM 🔷 Daily Chart Continuation pattern 🎯 Target = $3,380”
A daily-chart continuation pattern with a $3,380 target, about +36% above Ethereum's $2,485 mark that day. So far ETH dipped to $2,397 (−3.5%), then rose to $2,775 (+11.7%) on 22 September, but has slid back to $2,418 (−2.7%), below the call price. The target is now 39.8% away. Still open, but leaning against him.
𝕏 Post“#ETHEREUM 🔷 Daily Chart Continuation pattern 🎯 Target = $3,380” — @KevinSvenson_ on X↗ x.com“This exact setup has marked every major cycle low for $BTC for the last 15 years. It's time to start betting against the crowd”
With Bitcoin at $59,495, in “Extreme Fear” and below its two-year cost basis, he called a cycle-low setup and said to bet against the crowd. It was within a whisker of the bottom: Bitcoin dipped only −1.6% to $58,566 on 1 July, its 2026 low, then ran to $86,597 (+45.6%). It sits at $81,764 (+37.4%). Played out.
𝕏 Post“This exact setup has marked every major cycle low” — @KevinSvenson_ on X↗ x.com“If we reclaim and confirm price action above yesterday’s wick high, a trapped liquidity short squeeze initiates. Targeting 🎯 $79,500 (coincides with 1.272 Fib)”
Ein bedingtes Short-Squeeze-Setup ab $74,297 mit einem Ziel von $79,500 (etwa +7%). Bitcoin fiel am 20. April auf $73,841, schloss dann am 5. Mai mit $79,826 über dem Ziel und erreichte am 11. Mai einen Höchststand von $82,018. Der Squeeze hielt nicht: Bis zum 1. Juli fiel Bitcoin auf $58,566 (−21.2%). Das Ziel wurde erreicht — eingetroffen.
𝕏 Post“Targeting 🎯 $79,500 (coincides with 1.272 Fib)” — @KevinSvenson_ on X↗ x.com“1 more leg down seems about right. Then a bottom will form around $50K, we exit the downtrend, and we enter general accumulation for the rest of the year.”
From $71,304 he expected one more leg down to a bottom around $50K. Bitcoin first rallied to $82,018 on 11 May, then made that leg down to $58,566 (−17.9%) on 1 July, and has recovered to $81,764 (+14.7%). The shape he described happened — a final drop, then a turn — but the floor came in $8,566 above das genannte Level. Bitcoin never got near $50K. We grade it mixed: direction right, level wrong.
𝕏 Post“Then a bottom will form around $50K” — @KevinSvenson_ on X↗ x.comDie Ergebnisse sind unsere Einschätzung seiner erklärten Aussage gegenüber dem realen Kurs, nicht seine eigene Wertung. Jedes Zitat ist ein wörtlicher X-Post, auf seiner Karte verlinkt und im verifizierten Korpus vollständig wiedergegeben. Die Kurse sind Tageswerte von CoinGecko; ein Post während des Tages wird also vom Tageswert gemessen, und ein Docht durch ein Level erscheint möglicherweise nicht. Die Zeile „$1,000 in on their call“ auf dieser Seite bedeutet Kaufen und Halten ab dem Datum des Calls; Leerverkäufe werden nicht abgebildet. Sein Top-Call für 2025 von $140,000–$150,000 liegt außerhalb des Kursfensters und ist nicht im Chart, wird aber im Hintergrund beschrieben. Kurzfristige Bewertungen können sich ändern, während sich der Zyklus entscheidet.
Svenson's business mixes content with products and an exchange partnership. None of it is hidden — it is in his X bio and his own posts — but it is worth knowing before you act on a chart.
Seine X-Bio und viele seiner Chart-Posts enthalten einen BloFin-Partnerlink (partner.blofin.com/d/KevinSvenson), und sein YouTube-Kanal hat ein BloFin-Tutorial zu Spot- und Futures-Handel. Empfehlungslinks zahlen dem Postenden in der Regel einen Anteil an den Handelsgebühren der Personen, die sich anmelden, und Futures-Handel erzeugt mehr Gebühren als Halten.
Seine Bio führt ihn als CTO von AltvsBtc.com und verlinkt TokenTicker.app und agent4663.tech. Er bewirbt diese in seinen Posts; am 28. September etwa pries er TokenTicker als einfachsten Weg an, zu sehen, welche Ticker sich bewegen. Öffentliche Preise dafür haben wir nicht gefunden.
He also launches crypto tokens. On 26 August he posted “I launched a meme coin that airdrops $NVDA, $TSLA, $AMZN, $AAPL, and $SPY stock tokens simply by holding the token” — $StonkATM, on Robinhood Chain, which charges traders a fee when they sell. On 28 September he posted that “$TICKER holders will get access to paid features post graduation”, linking a Pons launchpad page, and his feed reposts other Pons launchpad tokens. A launcher can gain when his audience buys; we found no public disclosure of what he holds.
Der Kanal Kevin Svenson Crypto verdient an Aufrufen und etwaigen Sponsorings. Bullische, energiegeladene Titel („The Bull Market Starts NOW?!“) ziehen tendenziell mehr Aufrufe an — ein allgemeiner Anreiz, den man im Hinterkopf behalten sollte.
“This exact setup has marked every major cycle low for $BTC for the last 15 years. It's time to start betting against the crowd”
29 Jun 2026 · der Zyklustief-Call, der hielt“Then a bottom will form around $50K”
26 Mar 2026 · das Level, das nie kam“The bear market is officially over.”
21 Sep 2026 · der noch offene Regime-CallZitate stammen aus den eigenen öffentlichen Quellen; geäußerte Ansichten, keine Empfehlungen.
Svenson veröffentlicht lange Chart-Sessions auf seinem YouTube-Kanal Kevin Svenson Crypto. Repräsentative aktuelle Uploads:
 Robinhood Chain Triggered the Next Bull Cycle — Alt Season Is Here #Bitcoin #Ethereum #RobinhoodSeine Argumente dafür, dass der Altcoin-Zyklus begonnen hat.11 Sep 2026
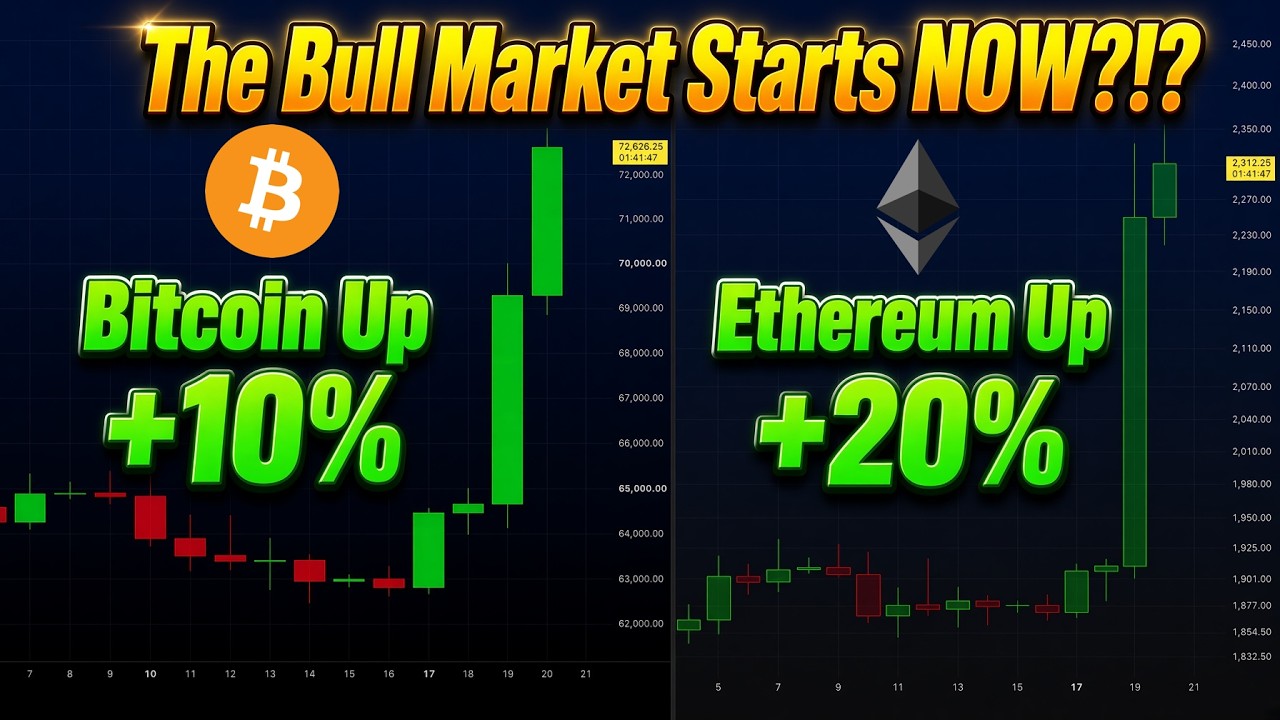 #Bitcoin +10% & #Ethereum +20% – The Bull Market Starts NOW?!Die August-Rally, gedeutet als Beginn einer Bullenwelle.20 Aug 2026
 This #Bitcoin Bottom Signal Has NEVER Been WrongDas Zyklustief-Signal hinter seinem Call vom 29. Juni.3 Jul 2026
 BIG SHIFT COMING FOR #BITCOIN #STOCKS $ALTS $ONDO $LINK $HYPEMarktübergreifende Sicht nahe den Mai-Hochs.8 May 2026
Ein Krypto-Chartanalyst, der Bitcoin- und Ethereum-Setups mit expliziten Zielen für rund 163,000 Follower auf X (@KevinSvenson_) postet und den YouTube-Kanal Kevin Svenson Crypto betreibt. Seine X-Bio führt ihn als CTO von AltvsBtc.com.
On our sample of seven dated 2026 posts: two played out, three are open, two went against. His April $79,500 target was hit on 5 May, and his 29 June cycle-low call came within 1.6% of the 2026 low. His 3 October calls for $92,000 Bitcoin and $3,200 Ethereum within 48 hours missed. His March call for a bottom around $50K missed the level (the low was $58,566), and his 2025 top target of $140,000–$150,000 missed (Bitcoin peaked near $126,000).
Indirectly. His posts and bio carry a BloFin exchange referral link, he promotes his own products (AltvsBtc.com, TokenTicker.app), he has launched his own tokens ($StonkATM in August 2026), and he earns from YouTube. We found no paid signal group.
Classical chart patterns with a trigger and a 🎯 target, often a Fibonacci extension, plus cycle analogies and sentiment extremes for the bigger picture. His record on near-term targets is mixed: two hits (April and June) and two 48-hour misses (October). His cycle-scale levels have been further off.
Svenson handelt das Muster und postet die Zahl. Wie nah ist Ihr Instinkt dran? Messen Sie es richtig mit einem Trader Passport.
Setzen Sie Ihren Ansatz jetzt in die Praxis um. Testen Sie Ihren Vorteil mit Live-Marktdaten ohne Kapitalrisiko in einem kostenlosen BuyCrypt-Turnier mit echten Preisen.
Informative und lehrreiche Analyse, die ausschließlich auf öffentlich zugänglichen Materialien beruht: datierten X-Beiträgen, die über die öffentlichen Schnittstellen von X erfasst wurden, und den bei jeder Prognose verlinkten Quellen. Keine Finanz- oder Anlageberatung. Die Zahlen sind Näherungswerte und ändern sich ständig. Spotted an error, or are you Kevin? Korrektur einreichen →
Verifizierte Handles · Quellen oben zitiert · Bewertungsmethodik · Aktualisiert 18 October 2026