@CarpeNoctom
An Ichimoku chartist who runs trading at the crypto ETF issuer Canary Capital and posts short, dated chart calls to about 149,000 followers. In 2026 his turns were mostly well timed. On 29 May, with Bitcoin at $73,652, he said it was probably headed for a 200-week moving average test, and six days later it was there. His April title “Here's How $BTC Hits ATH in 2026” is still a long way off, his September “M top” call was followed by a breakout, and he dropped his 6 October “rdy to rock” setup himself the next day.
Kurz gesagt. Josh Olszewicz trades Bitcoin and Ether from the Ichimoku cloud and classic chart patterns, and posts the setups on X as @CarpeNoctom. On our sample of eight in-window posts the record is 5 played out, 1 open, 2 went against. The best call was the bearish turn of 29 May: from $73,652 he expected a test of the 200-week moving average, which came on 4 June at $64,047 (−13.0%). He also called the July inverse head-and-shoulders target of 70k+ and Ether's August breakout (+32.2% in two weeks). The misses were the 11 September M top, which pointed to $70k–$72k while Bitcoin went to $86,597 instead, and a 6 October 4-hour breakout call that he abandoned the next day (“so much for that”). His 20 April title, a path to a new all-time high in 2026, is still open.
Josh Olszewicz ist VP und Head of Trading bei Canary Capital, einem US-Vermögensverwalter, der Krypto-ETFs auflegt. Seine X-Bio lautet “Canary.Capital PM & Head of Trading”. Laut Canarys eigener Teamseite leitete er zuvor die Krypto-Research bei BraveNewCoin, war Portfoliomanager bei Techemy Capital und Head of Research bei Valkyrie Investments. Vor Krypto unterrichtete er Laborwissenschaften auf Hochschulniveau; er hat einen BS in Humanbiologie und einen MS in Biotechnologie. Seit März 2009 ist er als @CarpeNoctom auf X.
Seine Inhalte folgen einem Wochenrhythmus: ein “Setup Sunday”-Video, ein “Macro Monday”, eine “Alt Coins”-Sendung und ein Freitags-Livestream “Broad Market Review”, dazu wöchentliche Posts zu den CME-Daten Commitments of Traders (CoT) und zu den Flows der US-Spot-ETFs. Die meisten seiner Chart-Posts decken neben Krypto auch Aktien ab. Diese Seite bewertet nur seine Bitcoin- und Ether-Calls, weil die Website diese Kurse verfolgt.
He also discloses a miss of his own. On 3 June 2026 he reposted his March 2018 post “ya, still on track for 33k by July” with the line “Heroes get remembered but bad calls never die”. Bitcoin did not come close to $33k in 2018. His weekly CoT posts read the data as bearish for most of the window, including through the July–September rally. We treat those as data reports, not price calls, and do not chart them. Eight posts qualified as calls, and several more were examined and excluded. Each is listed with its reason in the verified corpus.
Sources: x.com/CarpeNoctom (captured via api.fxtwitter.com and X syndication) · canary.capital/about · canaryetfs.com · linktr.ee/carpenoctom · YouTube oEmbed
Die Wolke entscheidet. Olszewicz liest den Trend aus der Ichimoku-Wolke („Kumo“): Darüber ist bullisch, darunter bärisch, und ein Ausbruch durch die Wolke ist ein Signal. Er kombiniert das mit klassischen Mustern: Schulter-Kopf-Schulter und inverse Schulter-Kopf-Schulter, Doppeltops („M“), fallende Keile und Fibonacci-Ziele. Die meisten Posts bestehen aus einer Zeile und einem Chart, mit einem Ziel oder einem Invalidierungslevel. Das macht sie leicht zu bewerten. Die Stärke ist das Drehen mit dem Trend: In dieser Stichprobe wurde er kurz vor dem Rückgang im Juni bärisch und vor dem Ausbruch im August wieder bullisch. Die Schwäche ist das Muster, das nie auslöst: Das M-Top im September hielt eine Pause für ein Top.
Nahezu neutral, und sie ändert sich mit dem Chart. Er war im April und Anfang Mai bullisch, wurde am 29. Mai unter der Tageswolke bärisch, im Juli und August wieder bullisch und meldete im September ein mögliches Top. Am 30. September schrieb er, er habe “never seen Q3 this bullish”.
Eight dated posts from @CarpeNoctom, each captured verbatim from X and charted against real price. The tally is 5 played out, 1 open, 2 went against. The record is strongest at the turns: the 29 May call for a 200-week moving average test, the 5 June “no bottom yet”, the 20 July 70k+ target and Ether's August breakout all played out. The 11 September M top and the 6 October “rdy to rock” setup went against, and the April all-time-high title is still open.
“4h $BTC looks rdy to rock (iHS)”
A bullish inverse head-and-shoulders on the 4-hour chart, posted at $85,771, the day after Bitcoin's October high. Four hours later he corrected his own post to “looked*”, and on 7 October he added: “well, so much for that, on to the next trade”. No higher daily mark followed. Bitcoin fell to $81,686 (−4.8%) on 9 October and $81,408 (−5.1%) on 18 October, and it is at $81,810 (−4.6%) now. He called the miss himself, within a day. Went against.
𝕏 Post“4h $BTC looks rdy to rock (iHS)” — @CarpeNoctom on X↗ x.com“looks like a potential M top here, downside fibs = 70-72”
Eine bärische Doppeltop-Lesart auf dem Tageschart, gepostet bei $76,555, mit Fibonacci-Zielen bei $70k–$72k. Der Rückgang kam nicht. Der tiefste Tageswert danach lag bei $75,590 (−1.3%) am 16. September, weit von den Zielen entfernt. Eine Woche später brach Bitcoin auf $86,597 (+13.1%) aus und hält $81,810 (+6.9%). Danebengelegen.
𝕏 Post“looks like a potential M top here, downside fibs = 70-72” — @CarpeNoctom on X↗ x.com“ethereum:native prepping for breakout”
Ein Ausbruchs-Call zu Ether, gepostet bei $1,902 nach Wochen der Seitwärtsbewegung. Er fiel am 11. August auf $1,871 (−1.6%) und brach dann aus: $2,515 (+32.2%) am 22. August und $2,775 (+45.9%) am 22. September. Er hält $2,403 (+26.3%). Eingetreten.
𝕏 Post“ethereum:native prepping for breakout” — @CarpeNoctom on X↗ x.com“a small nudge and $BTC is in full breakout territory iHS target = 70k+”
Ein Ziel aus einer inversen Schulter-Kopf-Schulter-Formation, gepostet bei $64,670. Der Anstoß dauerte einen Monat. Bitcoin rutschte zunächst am 2. August auf $62,773 (−2.9%). Dann schloss er am 21. August erstmals über $70k bei $73,021 (+12.9%) und stieg weiter bis $86,597 (+33.9%). Er hält $81,810 (+26.5%). Eingetreten.
𝕏 Post“a small nudge and $BTC is in full breakout territory” — @CarpeNoctom on X↗ x.com“$BTC pi cycle bottom suggests more no bottom yet”
Eine Lesart von Zyklusindikatoren, gepostet bei $63,811, einen Tag nachdem Bitcoin seinen 200-Wochen-Durchschnitt erreicht hatte. Es ging weiter abwärts: $60,855 (−4.6%) am 7. Juni und das Tief von 2026 bei $58,566 (−8.2%) am 1. Juli. Erst dann bildete sich der Boden. Bitcoin stieg danach auf $86,597 (+35.7%) und hält $81,810 (+28.2%). Eingetreten.
𝕏 Post“$BTC pi cycle bottom suggests more no bottom yet” — @CarpeNoctom on X↗ x.com“if channel support doesnt save this then we are probably headed for a 200WMA test bearish lean negated if/when price >79k above cloud”
Die bärische Wende, gepostet bei $73,652, als Bitcoin unter der Tageswolke lag und eine Schulter-Kopf-Schulter-Formation brach. Die Kanalunterstützung hielt nicht. Am 4. Juni notierte Bitcoin bei $64,047 (−13.0%), und er postete, dass der 200-Wochen-Durchschnitt erstmals seit Oktober 2023 erreicht sei. Der Boden lag bei $58,566 (−20.5%) am 1. Juli. Das Invalidierungslevel, ein Schlusskurs über $79k, kam erst am 27. August bei $79,018, drei Monate später. Bitcoin steht jetzt bei $81,810 (+11.1%), aber der Call galt dem Test, und der Test kam. Eingetreten.
𝕏 Post“1D $BTC — below daily Cloud now, bottom of channel, active H&S breakdown” — @CarpeNoctom on X↗ x.com“4h $BTC poised for a Sun open attempt higher”
Ein kurzfristiger Call auf dem 4-Stunden-Chart, gepostet bei $78,677. Bitcoin stieg: $81,437 (+3.5%) am 7. Mai und $82,018 (+4.2%) am 11. Mai, sein Frühjahrshoch. Am selben Abend schrieb er, die Erholung vom Drawdown sei die schnellste aller Zeiten, “if the low holds”. Es hielt nicht: Bis zum 1. Juli stand Bitcoin bei $58,566 (−25.6%). Jetzt steht er bei $81,810 (+4.0%). Der kurzfristige Call ist eingetreten; die größere Bewegung danach lief in die andere Richtung.
𝕏 Post“4h $BTC poised for a Sun open attempt higher” — @CarpeNoctom on X↗ x.com“Setup Sunday: Here's How $BTC Hits ATH in 2026”
The title of his weekly video, posted at $73,841, laying out a path to a new all-time high this year. The record is the October 2025 peak, above $120,000. Bitcoin first rose to $82,018 (+11.1%) on 11 May, then fell to $58,566 (−20.7%) on 1 July. It recovered to $86,597 (+17.3%) on 22 September and is at $81,810 (+10.8%) now. With ten weeks left in 2026, the record is still far away. Open.
𝕏 Post“Setup Sunday: Here's How $BTC Hits ATH in 2026” — @CarpeNoctom on X↗ x.comOutcomes are our read of the stated claim against real price, not his own scoring. Every quote is a verbatim X post, linked on its card and reproduced in full in the verified corpus. X's API writes the BTC and ETH token tags as “bitcoin:native” and “ethereum:native”, and we quote them as returned. We did not chart his weekly CoT and ETF-flow posts (data reports), hedged posts (“bull flag possible”), a 3 May post that was conditional on the low holding (it did not hold), or a later Puell Multiple post that restated the July bull case and would have scored as a win. From the 20 October refresh we also left out hedged or pattern-watch posts: “4h $BTC FW potential” (17 September), “1D $ETH unconfirmed hidden bull div” (8 October) and “$ETH H&S watch” (14 October), along with ratio charts such as SOL/BTC and ETH/BTC. Prices are CoinGecko daily marks, so an intraday post is measured from that day's mark. The 6 October card is graded from his own follow-ups, “looked*” the same day and “well, so much for that, on to the next trade” on 7 October, and from price. The “$1,000, eingesetzt auf diesen Call” line assumes buying on the post date; for the bearish 29 May and 11 September cards, that line is not a short. Near-term marks can flip.
Olszewiczs Posts und Streams sind kostenlos. Sein Haupteinkommen ist sein Job, und auf seiner Linkseite steht ein Börsenlink. Das haben wir gefunden.
Er ist VP und Head of Trading bei Canary Capital, das US-Krypto-ETFs auflegt, darunter Fonds auf HBAR, Litecoin, Solana, SUI, TRX und XRP. Einen Bitcoin- oder Ether-ETF führt das Unternehmen nicht. Wenn er über die Altcoins in diesen Fonds postet, sollte man bedenken, dass sein Arbeitgeber daran Gebühren verdient. Am 19. September postete er “Time to buy some $SUIS ?”, das ist der Ticker von Canarys Staked SUI ETF.
Der erste Link in seinem Linktree ist Kraken Pro, über einen getrackten Partnerlink (kraken.pxf.io). Solche Links zahlen dem Werber in der Regel etwas, wenn sich jemand anmeldet oder handelt. In seinen X-Posts haben wir keine Werbung für Börsen-Empfehlungsprogramme gefunden.
Die Sendungen “Setup Sunday”, “Macro Monday” und “Broad Market Review” laufen kostenlos auf X, YouTube und Twitch. Einen bezahlten Newsletter, eine bezahlte Gruppe oder einen Kurs haben wir nicht gefunden.
“if channel support doesnt save this then we are probably headed for a 200WMA test”
29 May 2026 · die Wende, die eintrat“Heroes get remembered but bad calls never die”
3 Jun 2026 · Repost seines Fehlgriffs von 2018“never seen Q3 this bullish”
30 Sep 2026 · zu Bitcoins Lauf von Juli bis SeptemberZitate stammen aus den eigenen öffentlichen Quellen; geäußerte Ansichten, keine Empfehlungen.
Olszewicz streamt auf YouTube (@carpenoctom), auf X und auf Twitch und postet jede Sendung auf X. Der Freitags-“Broad Market Review” behandelt Krypto, Makro und Aktien. Aktuelle Streams, die wir verifizieren konnten:
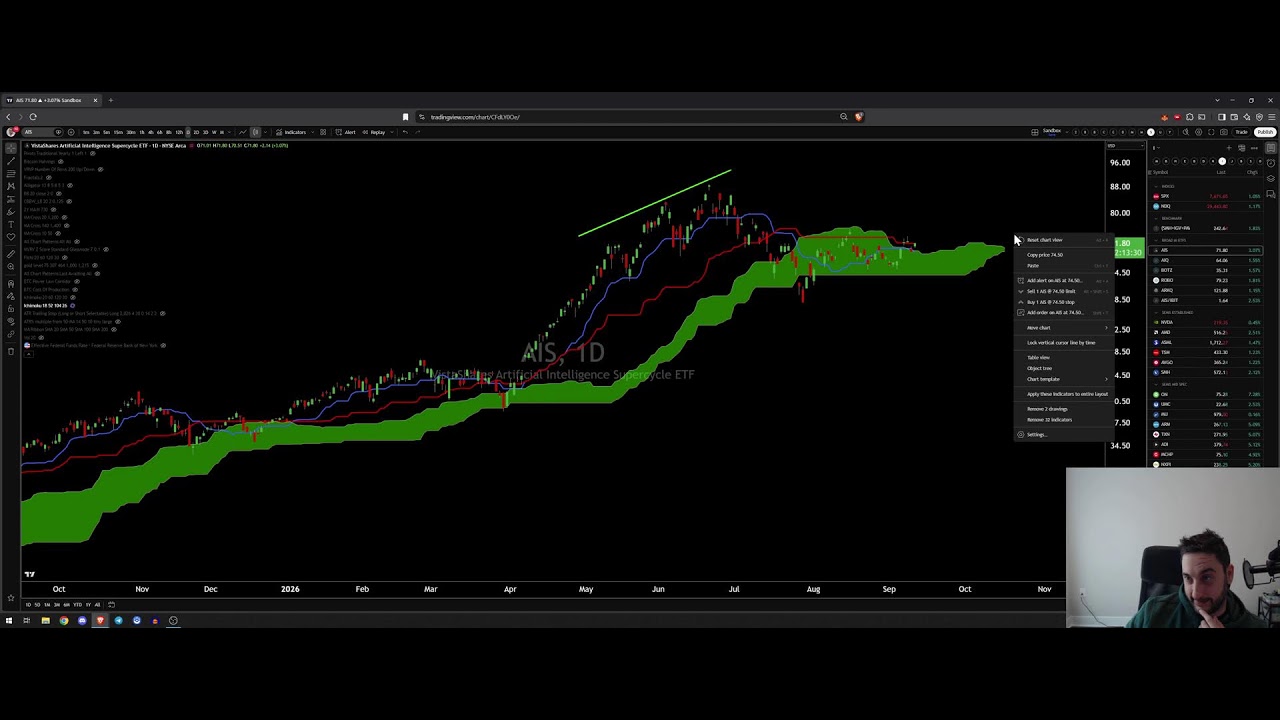 Broad Market Review: Drop It Like Its HotGestreamt am Tag seines M-Top-Calls.11 Sep 2026
 Broad Market Review: Breakout ConfirmedDer Bitcoin-Ausbruch im April, drei Tage vor dem Allzeithoch-Video.17 Apr 2026
 Broad Market Review - Home on the Choppy RangeBitcoin steckte Anfang April in seiner Range fest.3 Apr 2026
Ein Krypto-Trader und Analyst, der auf X als @CarpeNoctom für rund 149,000 Follower postet. Er ist VP und Head of Trading bei Canary Capital; davor war er Head of Research bei Valkyrie Investments und leitete die Krypto-Research bei BraveNewCoin. Seine Methode sind die Ichimoku-Wolke und klassische Chartmuster.
On our sample of eight dated 2026 posts: five played out, one is still open, two went against. His 29 May call for a 200-week moving average test came true within six days, and his 70k+ Bitcoin and August Ether breakout calls were hit. His 11 September M top call went against, as did a 6 October breakout setup that he dropped himself the next day. His April all-time-high title is still open.
Ein japanisches Chartsystem, das aus vergangenen Hochs und Tiefs ein schattiertes Band zeichnet, die „Wolke“ oder Kumo. Ein Kurs über der Wolke gilt als Aufwärtstrend, ein Kurs darunter als Abwärtstrend. Olszewicz nutzt Ausbrüche durch die Wolke als Signale.
Es wurde kein kostenpflichtiges Produkt gefunden. Seine Posts und Streams sind kostenlos. Er wird als Head of Trading bei Canary Capital bezahlt, und sein Linktree enthält einen getrackten Kraken-Pro-Link.
Nicht öffentlich bekannt, und es gibt keine glaubwürdige Zahl. Ignorieren Sie jede konkrete Summe, die Sie in Verbindung mit dem Namen sehen.
Olszewicz lässt die Wolke entscheiden. Wie nah ist Ihr Instinkt dran? Messen Sie es wirklich mit einem Trader-Pass.
Setzen Sie Ihren Ansatz jetzt in die Praxis um. Testen Sie Ihren Vorteil mit Live-Marktdaten ohne Kapitalrisiko in einem kostenlosen BuyCrypt-Turnier mit echten Preisen.
Informative und lehrreiche Analyse, die ausschließlich auf öffentlich zugänglichen Materialien beruht: datierten X-Beiträgen, die über die öffentlichen Schnittstellen von X erfasst wurden, und den bei jeder Prognose verlinkten Quellen. Keine Finanz- oder Anlageberatung. Die Zahlen sind Näherungswerte und ändern sich ständig. Spotted an error, or are you Josh? Korrektur einreichen →
Verifizierte Handles · Quellen oben zitiert · Bewertungsmethodik · Aktualisiert 20 October 2026