
@KevinSvenson_
A chart trader who puts a number on almost every setup — a 🎯 target, a Fibonacci level, a bottom zone — and posts it with a date. That makes him easy to grade. In 2026 his bullish reversal calls landed: a $79,500 squeeze target in April and a cycle-low call at $59K in June. His March call for a bottom around $50K got the direction right but the level wrong. In October his 48-hour breakout calls for $92K Bitcoin and $3,200 Ethereum missed, and his September ETH and “bear market is over” calls are still open.
간단히 말해. Kevin Svenson posts Bitcoin and Ethereum chart analysis to about 163,000 followers on X and runs the Kevin Svenson Crypto YouTube channel. His bio lists him as CTO of AltvsBtc.com. On our sample of seven in-window posts the record is 2 played out, 3 open, 2 went against. On 15 April he targeted $79,500 from $74,297, and Bitcoin closed above it on 5 May. On 29 June, at $59,495, he said the setup “has marked every major cycle low” — Bitcoin dipped only 1.6% further and is up 37.4% since. His 26 March call for “1 more leg down” to a bottom around $50K is graded open-mixed: the leg down came, but the low was $58,566, nowhere near $50K. On 3 October he gave Bitcoin $92,000 and Ethereum $3,200 within “the next 48 hours”; neither broke out, and both are below their call prices. Outside this chart window, his 2025 top call of $140,000–$150,000 missed (Bitcoin peaked near $126K).
Svenson은 X에서 @KevinSvenson_로 활동하며, 피드는 대부분 비트코인, 이더리움, 알트코인 지수의 일봉·주봉 차트로 각각 패턴 이름과 목표가가 붙어 있습니다. 그는 Kevin Svenson Crypto YouTube 채널도 운영하며, Daily Hodl은 2025년 9월 기준 구독자를 약 83,900명으로 보도했습니다. 그의 영상은 사이클 구조, 비트코인 도미넌스, 알트 시즌을 다루는 긴 “전략 세션”입니다. X 소개란에는 알트코인을 비트코인 대비로 차트화하는 사이트 AltvsBtc.com의 CTO로 적혀 있고, 다른 두 제품 agent4663.tech와 TokenTicker.app, 그리고 거래소 추천 링크가 걸려 있습니다. 그의 국적, 나이, 이전 경력에 대한 공개 기록은 찾지 못했으므로 이 페이지에서는 밝히지 않습니다.
이 차트 기간 밖에는 기록으로 남은 빗나간 전망도 있습니다. 2025년 7월 그는 시청자들에게 비트코인이 “vertical stage”에 들어서고 있다며 다음 고점 구간을 “$140,000 – $150,000”, “maybe around October”로 추정했습니다. 2025년 9월에는 $140,000–$150,000을 반복하며 고점 시기를 11월에서 1월 사이로 제시했습니다. 비트코인은 2025년 10월 $126,000 부근에서 고점을 찍은 뒤 2026년 약세장으로 접어들었습니다. 고점 시기는 근접했지만 레벨은 그렇지 않았습니다. 이 페이지의 대명사는 언론 용례를 따르며(Daily Hodl은 “he”로 표기), 그 본인이 밝힌 적은 없습니다.
Sources: x.com/KevinSvenson_ (captured via api.fxtwitter.com and X syndication) · YouTube channel UCVTbGN6Hzi4sSAz1bKHiDiQ · dailyhodl.com coverage (2025)
Classical chart patterns with explicit targets. He names the pattern (continuation, short-squeeze setup, rejection candles), marks the trigger, and posts a 🎯 target, often tied to a Fibonacci extension such as the 1.272. On longer timeframes he leans on cycle analogies — parabolic-curve bases, “every major cycle low for 15 years” — and sentiment extremes. The strength is that his calls are falsifiable: a number and a date. The weakness shows on cycle-scale levels: the $50K bottom and the 2025 $140,000–$150,000 top were both off by well over 10%, even when the direction was right. Short windows cut both ways too: his October 48-hour breakout calls for Bitcoin and Ethereum missed.
Bullish since the summer low. He called the cycle low on 29 June and declared the bear market over on 21 September. In this sample his only bearish call was the March “1 more leg down”, which he framed as the last drop before a year of accumulation. He stayed bullish into October, calling $92K Bitcoin on 3 and 6 October and saying on 12 October the weekly close was “in the bulls favor now”.
Seven dated posts from @KevinSvenson_, each captured verbatim from X and charted against real price. The tally is 2 played out, 3 open, 2 went against. The wins are the $79,500 squeeze target in April and the cycle-low call at $59,495 in June. The misses are his 3 October 48-hour breakout calls: $92,000 Bitcoin and $3,200 Ethereum. His March call for a $50K bottom is graded open-mixed: the leg down happened, the level did not. The September ETH target and the “bear market is officially over” call are still open, and both are back near or below their call prices.
“A push through local highs puts $92K in play. The chart says breakout in the next 48 hours.”
A “next daily target” of $92,000, about +8.9% above Bitcoin's $84,506 mark that day, with a 48-hour window for the breakout. Bitcoin's best mark after the post was $86,490 (+2.3%) on 5 October, still under the 22 September local high of $86,597. He repeated “$92,000 🎯 on next leg up” on 6 October, at $85,771. The breakout did not come: Bitcoin fell to $81,408 (−3.7%) and sits at $81,764 (−3.2%), with $92K still 12.5% away. On daily marks the 48 hours passed without the breakout, so we grade it went against.
𝕏 Post“$92,000 #Bitcoin 🟠 next daily target 🎯” — @KevinSvenson_ on X↗ x.com“A break of local highs puts $3,200 in play. Same window as Bitcoin: the next 48 hours decide.”
The Ethereum half of the same thread: a break of local highs would put $3,200 in play, about +19.9% above ETH's $2,668 mark, within the same 48 hours. ETH peaked at $2,726 (+2.2%) on 5 October, below its 22 September high of $2,775. It then dropped to $2,400 (−10.0%) and sits at $2,418 (−9.4%). The 48 hours passed without the break, and price fell — went against.
𝕏 Post“#Ethereum🔹 is tracking the same daily structure.” — @KevinSvenson_ on X↗ x.com“The bear market is officially over.”
A regime call, posted with “bull market loading” for Bitcoin, Ethereum and altcoins. Bitcoin was at $81,169, and that day's mark is still the floor: it has not closed lower since. It ran to $86,597 (+6.7%) the next day, but gave it all back: the lowest mark since is $81,408 on 18 October, and Bitcoin sits at $81,764 (+0.7%). Four weeks on it is flat, not a bull market yet, and not a new low either — open.
𝕏 Post“The bear market is officially over.” — @KevinSvenson_ on X↗ x.com“#ETHEREUM 🔷 Daily Chart Continuation pattern 🎯 Target = $3,380”
A daily-chart continuation pattern with a $3,380 target, about +36% above Ethereum's $2,485 mark that day. So far ETH dipped to $2,397 (−3.5%), then rose to $2,775 (+11.7%) on 22 September, but has slid back to $2,418 (−2.7%), below the call price. The target is now 39.8% away. Still open, but leaning against him.
𝕏 Post“#ETHEREUM 🔷 Daily Chart Continuation pattern 🎯 Target = $3,380” — @KevinSvenson_ on X↗ x.com“This exact setup has marked every major cycle low for $BTC for the last 15 years. It's time to start betting against the crowd”
With Bitcoin at $59,495, in “Extreme Fear” and below its two-year cost basis, he called a cycle-low setup and said to bet against the crowd. It was within a whisker of the bottom: Bitcoin dipped only −1.6% to $58,566 on 1 July, its 2026 low, then ran to $86,597 (+45.6%). It sits at $81,764 (+37.4%). Played out.
𝕏 Post“This exact setup has marked every major cycle low” — @KevinSvenson_ on X↗ x.com“If we reclaim and confirm price action above yesterday’s wick high, a trapped liquidity short squeeze initiates. Targeting 🎯 $79,500 (coincides with 1.272 Fib)”
$74,297에서 제시한 조건부 숏스퀴즈 셋업으로 목표가는 $79,500(약 +7%)입니다. 비트코인은 4월 20일 $73,841까지 내렸다가 5월 5일 목표 위인 $79,826에 마감했고, 5월 11일 $82,018에서 고점을 찍었습니다. 스퀴즈는 오래가지 않았습니다: 비트코인은 7월 1일까지 $58,566(−21.2%)으로 하락했습니다. 목표는 도달했습니다 — 적중.
𝕏 Post“Targeting 🎯 $79,500 (coincides with 1.272 Fib)” — @KevinSvenson_ on X↗ x.com“1 more leg down seems about right. Then a bottom will form around $50K, we exit the downtrend, and we enter general accumulation for the rest of the year.”
From $71,304 he expected one more leg down to a bottom around $50K. Bitcoin first rallied to $82,018 on 11 May, then made that leg down to $58,566 (−17.9%) on 1 July, and has recovered to $81,764 (+14.7%). The shape he described happened — a final drop, then a turn — but the floor came in $8,566 above 언급한 레벨. Bitcoin never got near $50K. We grade it mixed: direction right, level wrong.
𝕏 Post“Then a bottom will form around $50K” — @KevinSvenson_ on X↗ x.com결과는 그가 밝힌 주장을 실제 가격과 비교한 우리의 해석이며, 그 자신의 채점이 아닙니다. 모든 인용문은 X 게시물 원문이며, 카드에 링크되어 있고 검증 자료집에 전문이 수록되어 있습니다. 가격은 CoinGecko 일일 기준가이므로 장중 게시물은 그날의 기준가로 측정되며, 특정 레벨을 관통한 꼬리는 나타나지 않을 수 있습니다. 이 페이지의 “$1,000 in on their call” 줄은 전망일부터의 매수 후 보유 기준이며 공매도는 반영하지 않습니다. 그의 2025년 $140,000–$150,000 고점 전망은 가격 기간 밖이어서 차트에 표시하지 않았지만 배경 부분에서 설명합니다. 단기 평가는 사이클이 전개되면서 뒤바뀔 수 있습니다.
Svenson's business mixes content with products and an exchange partnership. None of it is hidden — it is in his X bio and his own posts — but it is worth knowing before you act on a chart.
그의 X 소개란과 많은 차트 게시물에는 BloFin 파트너 링크(partner.blofin.com/d/KevinSvenson)가 붙어 있고, 그의 YouTube 채널에는 BloFin 현물·선물 튜토리얼이 있습니다. 추천 링크는 보통 가입한 사람들의 거래 수수료 일부를 게시자에게 지급하며, 선물 거래는 보유보다 더 많은 수수료를 발생시킵니다.
그의 소개란에는 AltvsBtc.com의 CTO로 적혀 있고 TokenTicker.app과 agent4663.tech가 링크되어 있습니다. 그는 게시물에서 이들을 홍보합니다. 예를 들어 9월 28일에는 TokenTicker를 어떤 티커가 움직이는지 보는 가장 쉬운 방법이라고 소개했습니다. 이들 제품의 공개 가격은 찾지 못했습니다.
He also launches crypto tokens. On 26 August he posted “I launched a meme coin that airdrops $NVDA, $TSLA, $AMZN, $AAPL, and $SPY stock tokens simply by holding the token” — $StonkATM, on Robinhood Chain, which charges traders a fee when they sell. On 28 September he posted that “$TICKER holders will get access to paid features post graduation”, linking a Pons launchpad page, and his feed reposts other Pons launchpad tokens. A launcher can gain when his audience buys; we found no public disclosure of what he holds.
Kevin Svenson Crypto 채널은 조회수와 스폰서십을 통해 수익을 얻습니다. 강세 기조의 에너지 넘치는 제목(“The Bull Market Starts NOW?!”)은 더 많은 조회수를 끄는 경향이 있으며, 이는 염두에 둘 만한 일반적 유인입니다.
“This exact setup has marked every major cycle low for $BTC for the last 15 years. It's time to start betting against the crowd”
29 Jun 2026 · 유효했던 사이클 저점 전망“Then a bottom will form around $50K”
26 Mar 2026 · 끝내 오지 않은 레벨“The bear market is officially over.”
21 Sep 2026 · 아직 진행 중인 국면 전망인용문은 본인의 공개 출처에서 가져왔습니다. 밝힌 견해이지 권유가 아닙니다.
Svenson은 Kevin Svenson Crypto YouTube 채널에 긴 차트 세션을 게시합니다. 최근 대표 영상:
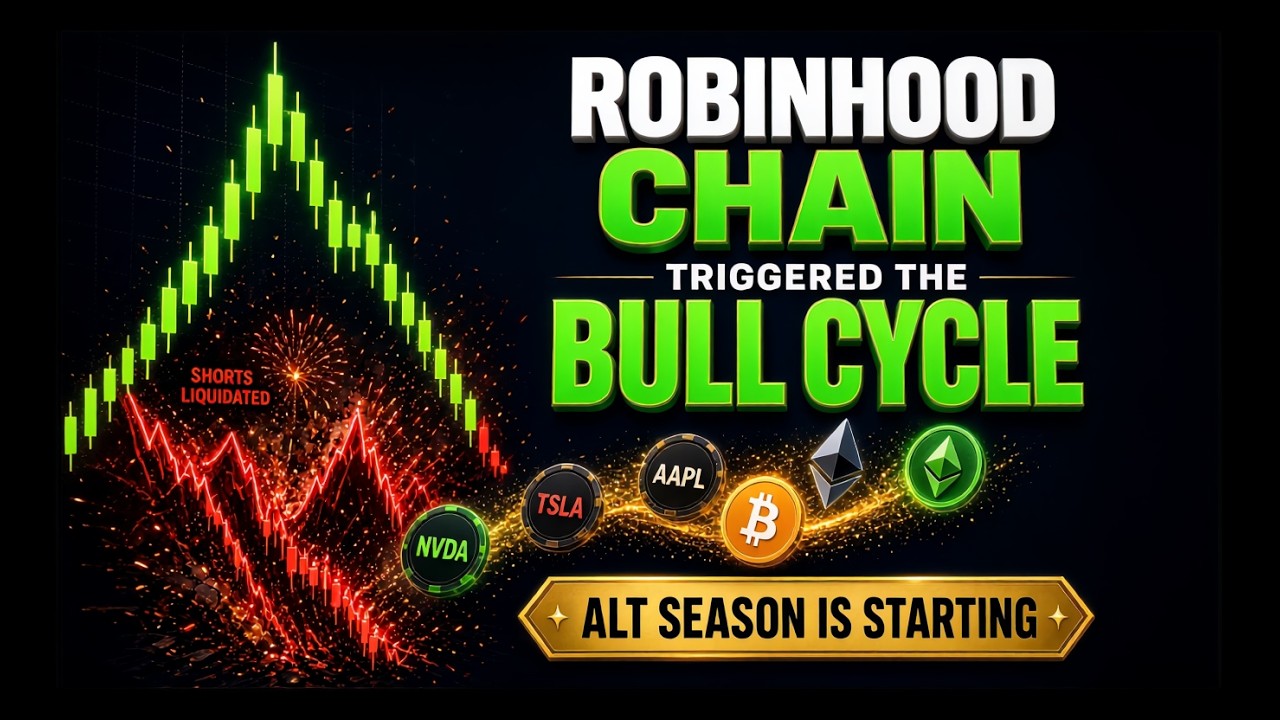 Robinhood Chain Triggered the Next Bull Cycle — Alt Season Is Here #Bitcoin #Ethereum #Robinhood알트 사이클이 시작됐다는 그의 주장.11 Sep 2026
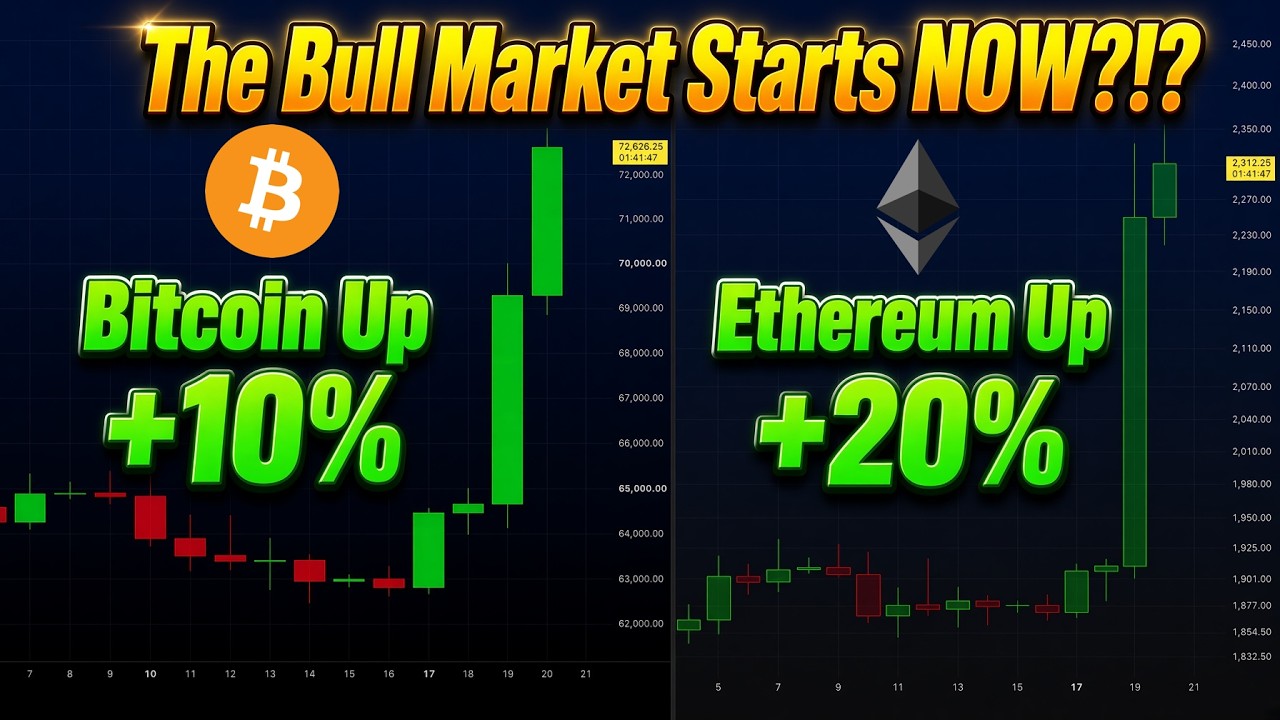 #Bitcoin +10% & #Ethereum +20% – The Bull Market Starts NOW?!8월 랠리를 강세 구간의 시작으로 해석.20 Aug 2026
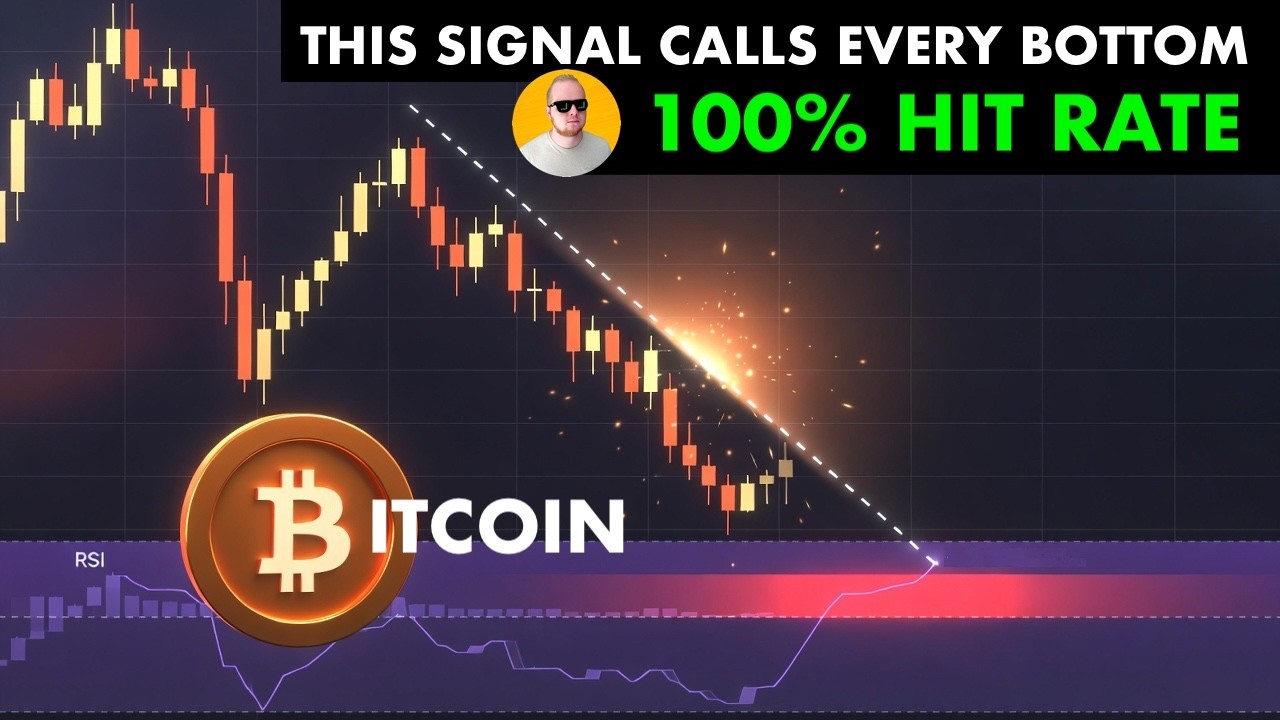 This #Bitcoin Bottom Signal Has NEVER Been Wrong6월 29일 전망의 근거가 된 사이클 저점 신호.3 Jul 2026
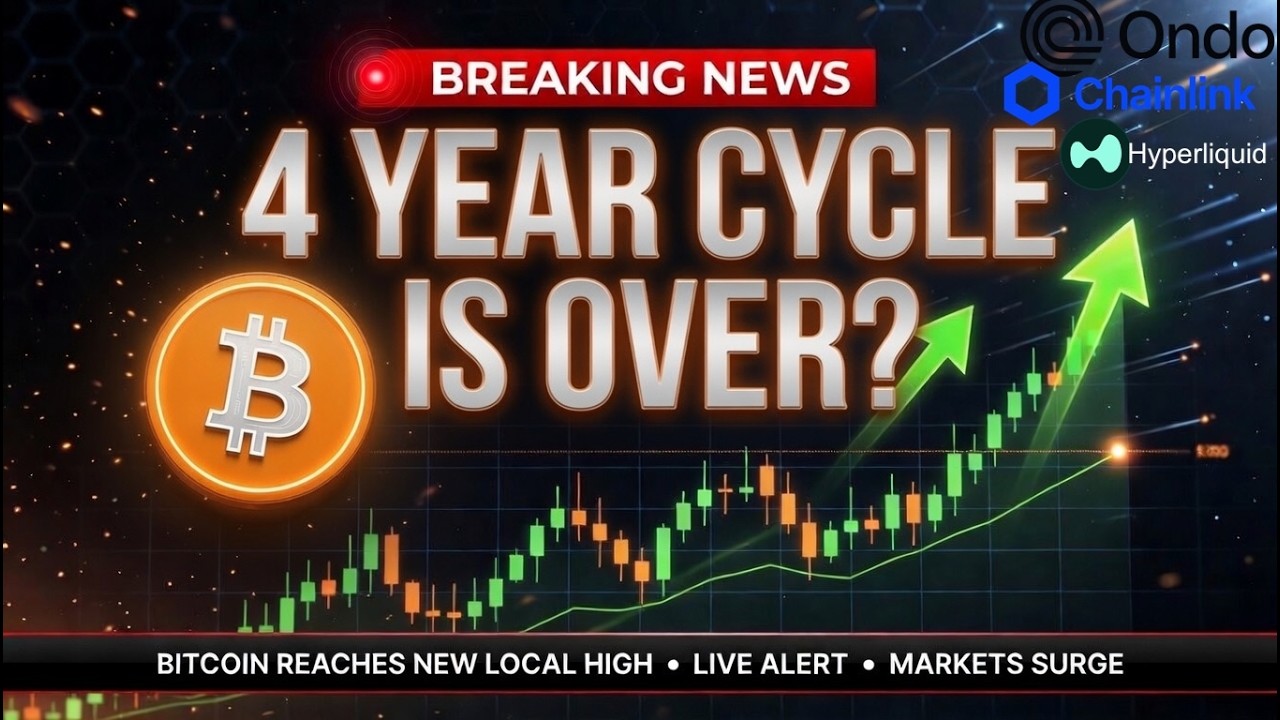 BIG SHIFT COMING FOR #BITCOIN #STOCKS $ALTS $ONDO $LINK $HYPE5월 고점 부근의 크로스마켓 관점.8 May 2026
X(@KevinSvenson_)에서 약 163,000명의 팔로워에게 명확한 목표가가 있는 비트코인·이더리움 셋업을 게시하고 Kevin Svenson Crypto YouTube 채널을 운영하는 크립토 차트 분석가입니다. 그의 X 소개란에는 AltvsBtc.com의 CTO로 적혀 있습니다.
On our sample of seven dated 2026 posts: two played out, three are open, two went against. His April $79,500 target was hit on 5 May, and his 29 June cycle-low call came within 1.6% of the 2026 low. His 3 October calls for $92,000 Bitcoin and $3,200 Ethereum within 48 hours missed. His March call for a bottom around $50K missed the level (the low was $58,566), and his 2025 top target of $140,000–$150,000 missed (Bitcoin peaked near $126,000).
Indirectly. His posts and bio carry a BloFin exchange referral link, he promotes his own products (AltvsBtc.com, TokenTicker.app), he has launched his own tokens ($StonkATM in August 2026), and he earns from YouTube. We found no paid signal group.
Classical chart patterns with a trigger and a 🎯 target, often a Fibonacci extension, plus cycle analogies and sentiment extremes for the bigger picture. His record on near-term targets is mixed: two hits (April and June) and two 48-hour misses (October). His cycle-scale levels have been further off.
Svenson은 패턴을 거래하고 숫자를 게시합니다. 당신의 직감은 얼마나 가까울까요? Trader Passport로 제대로 측정해 보세요.
이제 당신의 접근법을 실전에 적용해 보세요. 실제 상금이 걸린 무료 BuyCrypt 토너먼트에서 자본 위험 없이 실시간 시장 데이터로 당신의 강점을 시험해 보세요.