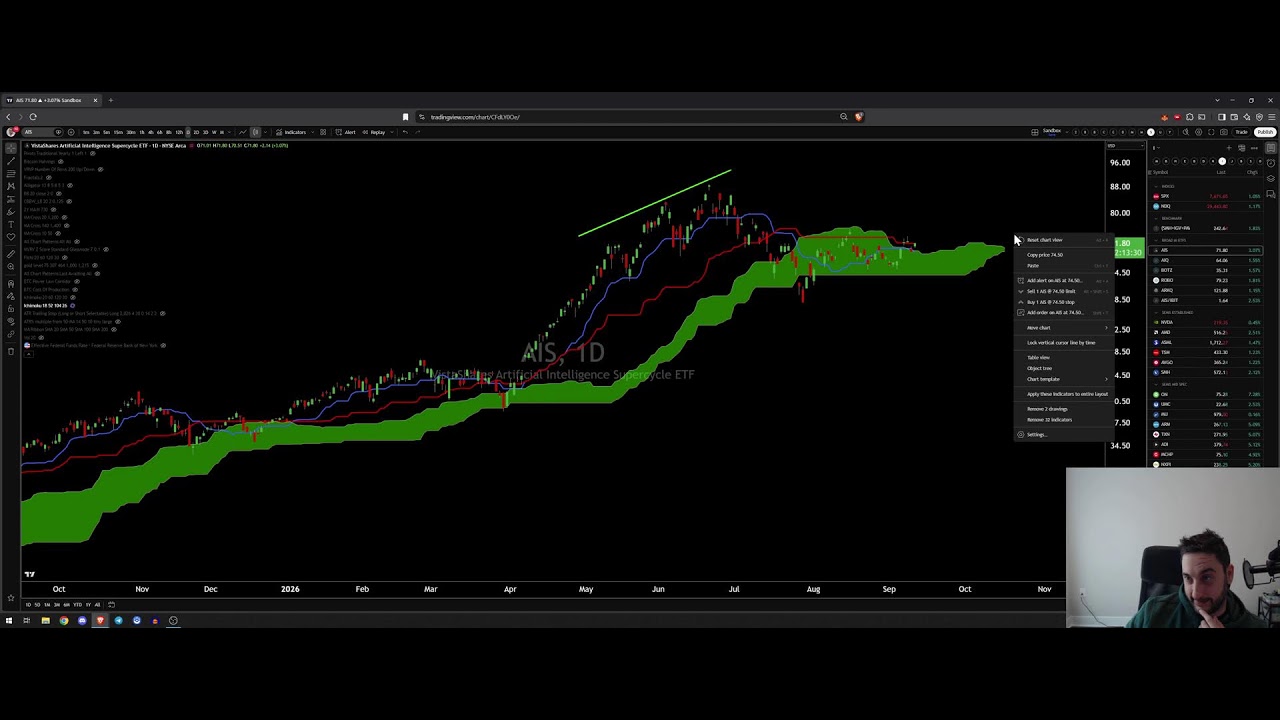
@CarpeNoctom
An Ichimoku chartist who runs trading at the crypto ETF issuer Canary Capital and posts short, dated chart calls to about 149,000 followers. In 2026 his turns were mostly well timed. On 29 May, with Bitcoin at $73,652, he said it was probably headed for a 200-week moving average test, and six days later it was there. His April title “Here's How $BTC Hits ATH in 2026” is still a long way off, his September “M top” call was followed by a breakout, and he dropped his 6 October “rdy to rock” setup himself the next day.
간단히 말해. Josh Olszewicz trades Bitcoin and Ether from the Ichimoku cloud and classic chart patterns, and posts the setups on X as @CarpeNoctom. On our sample of eight in-window posts the record is 5 played out, 1 open, 2 went against. The best call was the bearish turn of 29 May: from $73,652 he expected a test of the 200-week moving average, which came on 4 June at $64,047 (−13.0%). He also called the July inverse head-and-shoulders target of 70k+ and Ether's August breakout (+32.2% in two weeks). The misses were the 11 September M top, which pointed to $70k–$72k while Bitcoin went to $86,597 instead, and a 6 October 4-hour breakout call that he abandoned the next day (“so much for that”). His 20 April title, a path to a new all-time high in 2026, is still open.
Josh Olszewicz는 암호화폐 ETF를 발행하는 미국 자산운용사 Canary Capital의 VP 겸 트레이딩 총괄입니다. 그의 X 소개글은 “Canary.Capital PM & Head of Trading”입니다. Canary의 팀 페이지에 따르면 그는 이전에 BraveNewCoin에서 암호화폐 리서치를 이끌었고, Techemy Capital에서 포트폴리오 매니저로 일했으며, Valkyrie Investments에서 리서치 총괄을 맡았습니다. 암호화폐 이전에는 대학에서 실험 과학을 가르쳤고, 인간생물학 학사와 생명공학 석사 학위를 보유하고 있습니다. 2009년 3월부터 X에서 @CarpeNoctom으로 활동해 왔습니다.
그의 콘텐츠는 주간 리듬을 따릅니다: “Setup Sunday” 영상, “Macro Monday”, “Alt Coins” 방송, 금요일 “Broad Market Review” 라이브 방송, 그리고 CME 투자자별 포지션 보고서(CoT) 데이터와 미국 현물 ETF 자금 흐름에 대한 주간 게시물입니다. 차트 게시물 대부분은 암호화폐뿐 아니라 주식도 다룹니다. 이 페이지는 사이트가 추적하는 가격인 비트코인과 이더리움 콜만 채점합니다.
He also discloses a miss of his own. On 3 June 2026 he reposted his March 2018 post “ya, still on track for 33k by July” with the line “Heroes get remembered but bad calls never die”. Bitcoin did not come close to $33k in 2018. His weekly CoT posts read the data as bearish for most of the window, including through the July–September rally. We treat those as data reports, not price calls, and do not chart them. Eight posts qualified as calls, and several more were examined and excluded. Each is listed with its reason in the verified corpus.
Sources: x.com/CarpeNoctom (captured via api.fxtwitter.com and X syndication) · canary.capital/about · canaryetfs.com · linktr.ee/carpenoctom · YouTube oEmbed
구름대가 결정한다. Olszewicz는 일목균형표 구름대(“kumo”)로 추세를 읽습니다. 구름 위는 강세, 아래는 약세이고, 구름을 뚫는 돌파는 신호입니다. 여기에 고전 패턴을 결합합니다: 헤드앤숄더와 역헤드앤숄더, 이중 천장(“M”), 하락 쐐기, 피보나치 목표가. 대부분의 게시물은 한 줄과 차트 하나로, 목표가나 무효화 수준이 담겨 있습니다. 그래서 채점하기 쉽습니다. 강점은 추세와 함께 방향을 바꾸는 것입니다. 이 표본에서 그는 6월 하락 직전에 약세로, 8월 돌파 직전에 다시 강세로 돌아섰습니다. 약점은 발동하지 않는 패턴입니다. 9월의 M top은 횡보를 천장으로 읽었습니다.
중립에 가깝고, 차트에 따라 바뀝니다. 4월과 5월 초에는 강세였고, 5월 29일 일봉 구름대 아래에서 약세로 돌아섰으며, 7월과 8월에 다시 강세로 바뀐 뒤 9월에는 천장 가능성을 언급했습니다. 9월 30일에는 “never seen Q3 this bullish”라고 썼습니다.
Eight dated posts from @CarpeNoctom, each captured verbatim from X and charted against real price. The tally is 5 played out, 1 open, 2 went against. The record is strongest at the turns: the 29 May call for a 200-week moving average test, the 5 June “no bottom yet”, the 20 July 70k+ target and Ether's August breakout all played out. The 11 September M top and the 6 October “rdy to rock” setup went against, and the April all-time-high title is still open.
“4h $BTC looks rdy to rock (iHS)”
A bullish inverse head-and-shoulders on the 4-hour chart, posted at $85,771, the day after Bitcoin's October high. Four hours later he corrected his own post to “looked*”, and on 7 October he added: “well, so much for that, on to the next trade”. No higher daily mark followed. Bitcoin fell to $81,686 (−4.8%) on 9 October and $81,408 (−5.1%) on 18 October, and it is at $81,810 (−4.6%) now. He called the miss himself, within a day. Went against.
𝕏 Post“4h $BTC looks rdy to rock (iHS)” — @CarpeNoctom on X↗ x.com“looks like a potential M top here, downside fibs = 70-72”
일봉 차트의 약세 이중 천장 판독으로, $76,555에 게시됐고 피보나치 목표가는 $70k–$72k였습니다. 하락은 오지 않았습니다. 이후 최저 일별 기준가는 9월 16일 $75,590(−1.3%)로 목표가와 거리가 멀었습니다. 일주일 뒤 비트코인은 $86,597(+13.1%)로 돌파했고, 현재 $81,810(+6.9%)을 유지하고 있습니다. 빗나감.
𝕏 Post“looks like a potential M top here, downside fibs = 70-72” — @CarpeNoctom on X↗ x.com“ethereum:native prepping for breakout”
몇 주간의 횡보 끝에 $1,902에서 게시된 이더리움 돌파 콜입니다. 8월 11일 $1,871(−1.6%)까지 내려간 뒤 돌파했습니다: 8월 22일 $2,515(+32.2%), 9월 22일 $2,775(+45.9%). 현재 $2,403(+26.3%)를 유지하고 있습니다. 적중.
𝕏 Post“ethereum:native prepping for breakout” — @CarpeNoctom on X↗ x.com“a small nudge and $BTC is in full breakout territory iHS target = 70k+”
$64,670에서 게시된 역헤드앤숄더 목표입니다. 밀어 올리는 데 한 달이 걸렸습니다. 비트코인은 먼저 8월 2일 $62,773(−2.9%)까지 밀렸습니다. 이후 8월 21일 $73,021(+12.9%)로 처음 $70k 위에서 마감했고, $86,597(+33.9%)까지 계속 올랐습니다. 현재 $81,810(+26.5%)을 유지하고 있습니다. 적중.
𝕏 Post“a small nudge and $BTC is in full breakout territory” — @CarpeNoctom on X↗ x.com“$BTC pi cycle bottom suggests more no bottom yet”
비트코인이 200주 평균선에 닿은 다음 날 $63,811에서 게시된 사이클 지표 판독입니다. 추가 하락이 이어졌습니다: 6월 7일 $60,855(−4.6%), 그리고 7월 1일 2026년 저점 $58,566(−8.2%). 그제야 바닥이 형성됐습니다. 비트코인은 이후 $86,597(+35.7%)까지 올랐고 현재 $81,810(+28.2%)을 유지하고 있습니다. 적중.
𝕏 Post“$BTC pi cycle bottom suggests more no bottom yet” — @CarpeNoctom on X↗ x.com“if channel support doesnt save this then we are probably headed for a 200WMA test bearish lean negated if/when price >79k above cloud”
약세 전환 콜로, 비트코인이 일봉 구름대 아래에서 헤드앤숄더를 이탈하던 $73,652에 게시됐습니다. 채널 지지는 유지되지 않았습니다. 6월 4일 비트코인은 $64,047(−13.0%)을 기록했고, 그는 2023년 10월 이후 처음으로 200주 이동평균선에 도달했다고 게시했습니다. 7월 1일 $58,566(−20.5%)에서 바닥을 찍었습니다. 무효화 수준인 $79k 위 마감은 석 달 뒤인 8월 27일 $79,018에서야 나왔습니다. 비트코인은 현재 $81,810(+11.1%)이지만, 콜은 테스트에 관한 것이었고 테스트는 실현됐습니다. 적중.
𝕏 Post“1D $BTC — below daily Cloud now, bottom of channel, active H&S breakdown” — @CarpeNoctom on X↗ x.com“4h $BTC poised for a Sun open attempt higher”
$78,677에서 게시된 4시간 차트 단기 콜입니다. 비트코인은 상승했습니다: 5월 7일 $81,437(+3.5%), 봄철 고점인 5월 11일 $82,018(+4.2%). 같은 날 저녁 그는 “if the low holds” 낙폭 회복이 역대 가장 빠르다고 썼습니다. 저점은 유지되지 않았습니다. 7월 1일까지 비트코인은 $58,566(−25.6%)이 됐습니다. 현재는 $81,810(+4.0%)입니다. 단기 콜은 적중했지만, 이후의 더 큰 움직임은 반대 방향이었습니다.
𝕏 Post“4h $BTC poised for a Sun open attempt higher” — @CarpeNoctom on X↗ x.com“Setup Sunday: Here's How $BTC Hits ATH in 2026”
The title of his weekly video, posted at $73,841, laying out a path to a new all-time high this year. The record is the October 2025 peak, above $120,000. Bitcoin first rose to $82,018 (+11.1%) on 11 May, then fell to $58,566 (−20.7%) on 1 July. It recovered to $86,597 (+17.3%) on 22 September and is at $81,810 (+10.8%) now. With ten weeks left in 2026, the record is still far away. Open.
𝕏 Post“Setup Sunday: Here's How $BTC Hits ATH in 2026” — @CarpeNoctom on X↗ x.comOutcomes are our read of the stated claim against real price, not his own scoring. Every quote is a verbatim X post, linked on its card and reproduced in full in the verified corpus. X's API writes the BTC and ETH token tags as “bitcoin:native” and “ethereum:native”, and we quote them as returned. We did not chart his weekly CoT and ETF-flow posts (data reports), hedged posts (“bull flag possible”), a 3 May post that was conditional on the low holding (it did not hold), or a later Puell Multiple post that restated the July bull case and would have scored as a win. From the 20 October refresh we also left out hedged or pattern-watch posts: “4h $BTC FW potential” (17 September), “1D $ETH unconfirmed hidden bull div” (8 October) and “$ETH H&S watch” (14 October), along with ratio charts such as SOL/BTC and ETH/BTC. Prices are CoinGecko daily marks, so an intraday post is measured from that day's mark. The 6 October card is graded from his own follow-ups, “looked*” the same day and “well, so much for that, on to the next trade” on 7 October, and from price. The “그 콜에 넣은 $1,000” line assumes buying on the post date; for the bearish 29 May and 11 September cards, that line is not a short. Near-term marks can flip.
Olszewicz의 게시물과 방송은 무료입니다. 주 수입원은 본업이며, 링크 페이지에 거래소 링크가 있습니다. 저희가 확인한 내용은 다음과 같습니다.
그는 HBAR, Litecoin, Solana, SUI, TRX, XRP 펀드를 포함한 미국 암호화폐 ETF를 발행하는 Canary Capital의 VP 겸 트레이딩 총괄입니다. 비트코인이나 이더리움 ETF는 목록에 없습니다. 그가 이 펀드들의 알트코인에 대해 게시할 때는 그의 고용주가 그로부터 수수료를 번다는 점을 염두에 두세요. 9월 19일 그는 “Time to buy some $SUIS ?”라고 게시했는데, 이는 Canary의 Staked SUI ETF 티커입니다.
그의 Linktree 첫 번째 링크는 추적용 파트너 링크(kraken.pxf.io)를 거치는 Kraken Pro입니다. 이런 링크는 보통 누군가 가입하거나 거래하면 추천인에게 보상을 지급합니다. 그의 X 게시물에서 거래소 추천 홍보는 찾지 못했습니다.
“Setup Sunday”, “Macro Monday”, “Broad Market Review” 방송은 X, YouTube, Twitch에서 무료로 스트리밍됩니다. 유료 뉴스레터, 유료 그룹, 강의는 찾지 못했습니다.
“if channel support doesnt save this then we are probably headed for a 200WMA test”
29 May 2026 · 적중한 전환 콜“Heroes get remembered but bad calls never die”
3 Jun 2026 · 자신의 2018년 실패를 다시 공유하며“never seen Q3 this bullish”
30 Sep 2026 · 비트코인의 7월–9월 상승에 대해인용문은 본인의 공개 출처에서 가져왔습니다. 밝힌 견해이지 권유가 아닙니다.
Olszewicz는 YouTube(@carpenoctom), X, Twitch에서 방송하며 각 방송을 X에 올립니다. 금요일 “Broad Market Review”는 암호화폐, 거시경제, 주식을 다룹니다. 저희가 확인할 수 있었던 최근 방송:
X에서 @CarpeNoctom으로 약 149,000명의 팔로워에게 게시하는 암호화폐 트레이더이자 애널리스트입니다. Canary Capital의 VP 겸 트레이딩 총괄이며, 그 전에는 Valkyrie Investments의 리서치 총괄이었고 BraveNewCoin에서 암호화폐 리서치를 이끌었습니다. 그의 방법은 일목균형표 구름대와 고전적 차트 패턴입니다.
On our sample of eight dated 2026 posts: five played out, one is still open, two went against. His 29 May call for a 200-week moving average test came true within six days, and his 70k+ Bitcoin and August Ether breakout calls were hit. His 11 September M top call went against, as did a 6 October breakout setup that he dropped himself the next day. His April all-time-high title is still open.
과거 고점과 저점으로 음영 띠, 즉 “구름” 또는 kumo를 그리는 일본의 차트 기법입니다. 가격이 구름 위에 있으면 상승 추세, 아래에 있으면 하락 추세로 봅니다. Olszewicz는 구름대 돌파를 신호로 사용합니다.
유료 상품은 찾지 못했습니다. 그의 게시물과 방송은 무료입니다. 그는 Canary Capital 트레이딩 총괄로 급여를 받으며, Linktree에는 추적용 Kraken Pro 링크가 있습니다.
공개된 바 없으며 신뢰할 만한 수치도 없습니다. 이 이름에 붙은 구체적인 숫자는 무시하세요.
Olszewicz는 구름대가 판단하게 합니다. 당신의 직감은 얼마나 가까운가요? Trader Passport로 제대로 측정해 보세요.
이제 당신의 접근법을 실전에 적용해 보세요. 실제 상금이 걸린 무료 BuyCrypt 토너먼트에서 자본 위험 없이 실시간 시장 데이터로 당신의 강점을 시험해 보세요.