
@KevinSvenson_
A chart trader who puts a number on almost every setup — a 🎯 target, a Fibonacci level, a bottom zone — and posts it with a date. That makes him easy to grade. In 2026 his bullish reversal calls landed: a $79,500 squeeze target in April and a cycle-low call at $59K in June. His March call for a bottom around $50K got the direction right but the level wrong. In October his 48-hour breakout calls for $92K Bitcoin and $3,200 Ethereum missed, and his September ETH and “bear market is over” calls are still open.
संक्षेप में। Kevin Svenson posts Bitcoin and Ethereum chart analysis to about 163,000 followers on X and runs the Kevin Svenson Crypto YouTube channel. His bio lists him as CTO of AltvsBtc.com. On our sample of seven in-window posts the record is 2 played out, 3 open, 2 went against. On 15 April he targeted $79,500 from $74,297, and Bitcoin closed above it on 5 May. On 29 June, at $59,495, he said the setup “has marked every major cycle low” — Bitcoin dipped only 1.6% further and is up 37.4% since. His 26 March call for “1 more leg down” to a bottom around $50K is graded open-mixed: the leg down came, but the low was $58,566, nowhere near $50K. On 3 October he gave Bitcoin $92,000 and Ethereum $3,200 within “the next 48 hours”; neither broke out, and both are below their call prices. Outside this chart window, his 2025 top call of $140,000–$150,000 missed (Bitcoin peaked near $126K).
Svenson X पर @KevinSvenson_ के नाम से पोस्ट करते हैं, जहाँ उनकी फ़ीड में ज़्यादातर Bitcoin, Ethereum और ऑल्टकॉइन इंडेक्स के दैनिक और साप्ताहिक चार्ट होते हैं, हर एक के साथ पैटर्न का नाम और टारगेट। वे Kevin Svenson Crypto YouTube चैनल भी चलाते हैं; Daily Hodl के अनुसार सितंबर 2025 में इसके लगभग 83,900 सब्सक्राइबर थे। उनके अपलोड साइकिल की संरचना, Bitcoin डॉमिनेंस और ऑल्ट सीज़न पर लंबे “strategy sessions” होते हैं। उनके X बायो में उन्हें AltvsBtc.com का CTO बताया गया है, जो ऑल्टकॉइन को Bitcoin के मुकाबले चार्ट करने वाली साइट है, और इसमें दो अन्य प्रोडक्ट्स, agent4663.tech और TokenTicker.app, के साथ एक एक्सचेंज रेफ़रल लिंक भी है। हमें उनके देश, उम्र या पिछले करियर का कोई सार्वजनिक रिकॉर्ड नहीं मिला, इसलिए यह पेज इनका उल्लेख नहीं करता।
उनकी एक दर्ज चूक भी है जो इस चार्ट विंडो के बाहर है। जुलाई 2025 में उन्होंने दर्शकों से कहा कि Bitcoin “vertical stage” में प्रवेश कर रहा है और अगले टॉप ज़ोन का अनुमान “$140,000 – $150,000” लगाया, “maybe around October”। सितंबर 2025 में उन्होंने नवंबर से जनवरी के आसपास टॉप के साथ $140,000–$150,000 को दोहराया। Bitcoin अक्टूबर 2025 में लगभग $126,000 पर शिखर पर पहुँचा और फिर 2026 के बेयर मार्केट में गिर गया। शिखर का उनका समय करीब था; स्तर नहीं। इस पेज पर सर्वनाम प्रेस के प्रयोग का पालन करते हैं (Daily Hodl “he” लिखता है); उन्होंने स्वयं इन्हें नहीं बताया है।
Sources: x.com/KevinSvenson_ (captured via api.fxtwitter.com and X syndication) · YouTube channel UCVTbGN6Hzi4sSAz1bKHiDiQ · dailyhodl.com coverage (2025)
Classical chart patterns with explicit targets. He names the pattern (continuation, short-squeeze setup, rejection candles), marks the trigger, and posts a 🎯 target, often tied to a Fibonacci extension such as the 1.272. On longer timeframes he leans on cycle analogies — parabolic-curve bases, “every major cycle low for 15 years” — and sentiment extremes. The strength is that his calls are falsifiable: a number and a date. The weakness shows on cycle-scale levels: the $50K bottom and the 2025 $140,000–$150,000 top were both off by well over 10%, even when the direction was right. Short windows cut both ways too: his October 48-hour breakout calls for Bitcoin and Ethereum missed.
Bullish since the summer low. He called the cycle low on 29 June and declared the bear market over on 21 September. In this sample his only bearish call was the March “1 more leg down”, which he framed as the last drop before a year of accumulation. He stayed bullish into October, calling $92K Bitcoin on 3 and 6 October and saying on 12 October the weekly close was “in the bulls favor now”.
Seven dated posts from @KevinSvenson_, each captured verbatim from X and charted against real price. The tally is 2 played out, 3 open, 2 went against. The wins are the $79,500 squeeze target in April and the cycle-low call at $59,495 in June. The misses are his 3 October 48-hour breakout calls: $92,000 Bitcoin and $3,200 Ethereum. His March call for a $50K bottom is graded open-mixed: the leg down happened, the level did not. The September ETH target and the “bear market is officially over” call are still open, and both are back near or below their call prices.
“A push through local highs puts $92K in play. The chart says breakout in the next 48 hours.”
A “next daily target” of $92,000, about +8.9% above Bitcoin's $84,506 mark that day, with a 48-hour window for the breakout. Bitcoin's best mark after the post was $86,490 (+2.3%) on 5 October, still under the 22 September local high of $86,597. He repeated “$92,000 🎯 on next leg up” on 6 October, at $85,771. The breakout did not come: Bitcoin fell to $81,408 (−3.7%) and sits at $81,764 (−3.2%), with $92K still 12.5% away. On daily marks the 48 hours passed without the breakout, so we grade it went against.
𝕏 Post“$92,000 #Bitcoin 🟠 next daily target 🎯” — @KevinSvenson_ on X↗ x.com“A break of local highs puts $3,200 in play. Same window as Bitcoin: the next 48 hours decide.”
The Ethereum half of the same thread: a break of local highs would put $3,200 in play, about +19.9% above ETH's $2,668 mark, within the same 48 hours. ETH peaked at $2,726 (+2.2%) on 5 October, below its 22 September high of $2,775. It then dropped to $2,400 (−10.0%) and sits at $2,418 (−9.4%). The 48 hours passed without the break, and price fell — went against.
𝕏 Post“#Ethereum🔹 is tracking the same daily structure.” — @KevinSvenson_ on X↗ x.com“The bear market is officially over.”
A regime call, posted with “bull market loading” for Bitcoin, Ethereum and altcoins. Bitcoin was at $81,169, and that day's mark is still the floor: it has not closed lower since. It ran to $86,597 (+6.7%) the next day, but gave it all back: the lowest mark since is $81,408 on 18 October, and Bitcoin sits at $81,764 (+0.7%). Four weeks on it is flat, not a bull market yet, and not a new low either — open.
𝕏 Post“The bear market is officially over.” — @KevinSvenson_ on X↗ x.com“#ETHEREUM 🔷 Daily Chart Continuation pattern 🎯 Target = $3,380”
A daily-chart continuation pattern with a $3,380 target, about +36% above Ethereum's $2,485 mark that day. So far ETH dipped to $2,397 (−3.5%), then rose to $2,775 (+11.7%) on 22 September, but has slid back to $2,418 (−2.7%), below the call price. The target is now 39.8% away. Still open, but leaning against him.
𝕏 Post“#ETHEREUM 🔷 Daily Chart Continuation pattern 🎯 Target = $3,380” — @KevinSvenson_ on X↗ x.com“This exact setup has marked every major cycle low for $BTC for the last 15 years. It's time to start betting against the crowd”
With Bitcoin at $59,495, in “Extreme Fear” and below its two-year cost basis, he called a cycle-low setup and said to bet against the crowd. It was within a whisker of the bottom: Bitcoin dipped only −1.6% to $58,566 on 1 July, its 2026 low, then ran to $86,597 (+45.6%). It sits at $81,764 (+37.4%). Played out.
𝕏 Post“This exact setup has marked every major cycle low” — @KevinSvenson_ on X↗ x.com“If we reclaim and confirm price action above yesterday’s wick high, a trapped liquidity short squeeze initiates. Targeting 🎯 $79,500 (coincides with 1.272 Fib)”
$74,297 से एक सशर्त शॉर्ट-स्क्वीज़ सेटअप, $79,500 के टारगेट के साथ (लगभग +7%)। Bitcoin 20 अप्रैल को $73,841 तक गिरा, फिर 5 मई को टारगेट के ऊपर $79,826 पर बंद हुआ और 11 मई को $82,018 के शिखर पर पहुँचा। स्क्वीज़ टिका नहीं: 1 जुलाई तक Bitcoin $58,566 (−21.2%) तक गिर गया। टारगेट हासिल हुआ — सही निकला।
𝕏 Post“Targeting 🎯 $79,500 (coincides with 1.272 Fib)” — @KevinSvenson_ on X↗ x.com“1 more leg down seems about right. Then a bottom will form around $50K, we exit the downtrend, and we enter general accumulation for the rest of the year.”
From $71,304 he expected one more leg down to a bottom around $50K. Bitcoin first rallied to $82,018 on 11 May, then made that leg down to $58,566 (−17.9%) on 1 July, and has recovered to $81,764 (+14.7%). The shape he described happened — a final drop, then a turn — but the floor came in $8,566 above बताया गया स्तर. Bitcoin never got near $50K. We grade it mixed: direction right, level wrong.
𝕏 Post“Then a bottom will form around $50K” — @KevinSvenson_ on X↗ x.comनतीजे असली कीमत के मुकाबले उनके घोषित दावे की हमारी व्याख्या हैं, उनका अपना मूल्यांकन नहीं। हर उद्धरण X की शब्दशः पोस्ट है, जो अपने कार्ड पर लिंक है और सत्यापित संग्रह में पूरी तरह दी गई है। कीमतें CoinGecko के दैनिक मार्क हैं, इसलिए दिन के दौरान की गई पोस्ट को उस दिन के मार्क से मापा जाता है, और किसी स्तर को छूती विक शायद न दिखे। इस पेज पर “$1,000 in on their call” वाली पंक्ति कॉल की तारीख से बाय-एंड-होल्ड है; यह शॉर्टिंग का मॉडल नहीं बनाती। 2025 का उनका $140,000–$150,000 का टॉप कॉल प्राइस विंडो के बाहर है और चार्ट नहीं किया गया है, लेकिन पृष्ठभूमि में उसका वर्णन है। साइकिल के स्पष्ट होने के साथ नज़दीकी अवधि के मार्क बदल सकते हैं।
Svenson's business mixes content with products and an exchange partnership. None of it is hidden — it is in his X bio and his own posts — but it is worth knowing before you act on a chart.
उनके X बायो और उनकी कई चार्ट पोस्ट में BloFin का पार्टनर लिंक (partner.blofin.com/d/KevinSvenson) होता है, और उनके YouTube चैनल पर BloFin स्पॉट-और-फ़्यूचर्स ट्यूटोरियल है। रेफ़रल लिंक आमतौर पर पोस्ट करने वाले को साइन अप करने वालों की ट्रेडिंग फ़ीस का एक हिस्सा देते हैं, और फ़्यूचर्स ट्रेडिंग होल्ड करने की तुलना में ज़्यादा फ़ीस पैदा करती है।
उनके बायो में उन्हें AltvsBtc.com का CTO बताया गया है और TokenTicker.app तथा agent4663.tech के लिंक हैं। वे अपनी पोस्ट में इनका प्रचार करते हैं; उदाहरण के लिए, 28 सितंबर को उन्होंने TokenTicker को यह देखने का सबसे आसान तरीका बताया कि कौन-से टिकर हिल रहे हैं। हमें इनकी कोई सार्वजनिक कीमत नहीं मिली।
He also launches crypto tokens. On 26 August he posted “I launched a meme coin that airdrops $NVDA, $TSLA, $AMZN, $AAPL, and $SPY stock tokens simply by holding the token” — $StonkATM, on Robinhood Chain, which charges traders a fee when they sell. On 28 September he posted that “$TICKER holders will get access to paid features post graduation”, linking a Pons launchpad page, and his feed reposts other Pons launchpad tokens. A launcher can gain when his audience buys; we found no public disclosure of what he holds.
Kevin Svenson Crypto चैनल व्यूज़ और किसी भी स्पॉन्सरशिप से कमाता है। बुलिश, जोशीले शीर्षक (“The Bull Market Starts NOW?!”) आमतौर पर ज़्यादा व्यूज़ खींचते हैं, जो ध्यान में रखने लायक एक सामान्य प्रोत्साहन है।
“This exact setup has marked every major cycle low for $BTC for the last 15 years. It's time to start betting against the crowd”
29 Jun 2026 · साइकिल-लो कॉल जो टिका रहा“Then a bottom will form around $50K”
26 Mar 2026 · वह स्तर जो कभी नहीं आया“The bear market is officially over.”
21 Sep 2026 · बाज़ार के दौर का कॉल जो अभी खुला हैउद्धरण उनके अपने सार्वजनिक स्रोतों से लिए गए हैं; ये व्यक्त किए गए विचार हैं, सिफ़ारिशें नहीं।
Svenson अपने Kevin Svenson Crypto YouTube चैनल पर लंबे चार्ट सेशन प्रकाशित करते हैं। हाल के प्रतिनिधि अपलोड:
 Robinhood Chain Triggered the Next Bull Cycle — Alt Season Is Here #Bitcoin #Ethereum #Robinhoodउनका तर्क कि ऑल्ट साइकिल शुरू हो चुका है।11 Sep 2026
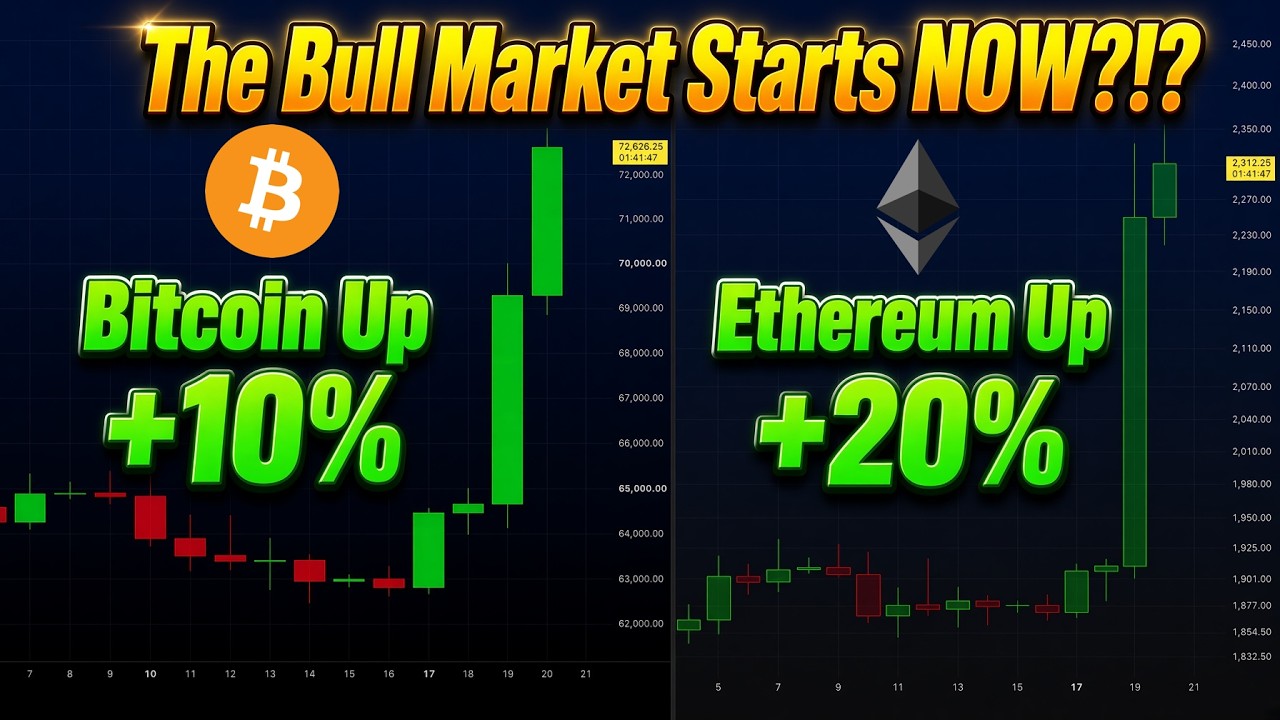 #Bitcoin +10% & #Ethereum +20% – The Bull Market Starts NOW?!अगस्त की तेज़ी, जिसे एक बुल लेग की शुरुआत के रूप में पढ़ा गया।20 Aug 2026
 This #Bitcoin Bottom Signal Has NEVER Been Wrong29 जून के उनके कॉल के पीछे का साइकिल-लो संकेत।3 Jul 2026
 BIG SHIFT COMING FOR #BITCOIN #STOCKS $ALTS $ONDO $LINK $HYPEमई के ऊँचे स्तरों के आसपास विभिन्न बाज़ारों का दृष्टिकोण।8 May 2026
एक क्रिप्टो चार्ट विश्लेषक जो X (@KevinSvenson_) पर लगभग 163,000 फ़ॉलोअर्स के लिए स्पष्ट टारगेट के साथ Bitcoin और Ethereum सेटअप पोस्ट करते हैं और Kevin Svenson Crypto YouTube चैनल चलाते हैं। उनके X बायो में उन्हें AltvsBtc.com का CTO बताया गया है।
On our sample of seven dated 2026 posts: two played out, three are open, two went against. His April $79,500 target was hit on 5 May, and his 29 June cycle-low call came within 1.6% of the 2026 low. His 3 October calls for $92,000 Bitcoin and $3,200 Ethereum within 48 hours missed. His March call for a bottom around $50K missed the level (the low was $58,566), and his 2025 top target of $140,000–$150,000 missed (Bitcoin peaked near $126,000).
Indirectly. His posts and bio carry a BloFin exchange referral link, he promotes his own products (AltvsBtc.com, TokenTicker.app), he has launched his own tokens ($StonkATM in August 2026), and he earns from YouTube. We found no paid signal group.
Classical chart patterns with a trigger and a 🎯 target, often a Fibonacci extension, plus cycle analogies and sentiment extremes for the bigger picture. His record on near-term targets is mixed: two hits (April and June) and two 48-hour misses (October). His cycle-scale levels have been further off.
Svenson पैटर्न पर ट्रेड करते हैं और संख्या पोस्ट करते हैं। आपकी सहज समझ कितनी करीब है? Trader Passport के साथ इसे सच में मापें।
अब अपने तरीक़े को आज़माएँ। असली इनामों वाले मुफ़्त BuyCrypt टूर्नामेंट में, बिना किसी पूँजी के जोखिम के, लाइव बाज़ार डेटा पर अपनी बढ़त परखें।
सूचनात्मक और शैक्षिक विश्लेषण, जो पूरी तरह सार्वजनिक रूप से उपलब्ध सामग्री पर आधारित है: X के सार्वजनिक एंडपॉइंट से ली गई तारीख़ वाली X पोस्ट और हर अनुमान पर लिंक किए गए स्रोत। यह वित्तीय या निवेश सलाह नहीं है। आँकड़े अनुमानित हैं और लगातार बदलते रहते हैं। Spotted an error, or are you Kevin? सुधार प्रस्तुत करें →
सत्यापित हैंडल · ऊपर उद्धृत स्रोत · स्कोरिंग पद्धति · अद्यतन किया गया 18 October 2026