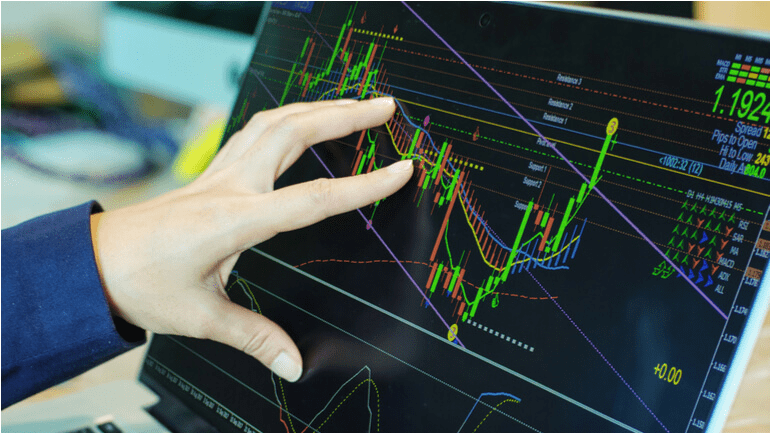
Stock charts are necessary for traders to track the price dynamics of the market. Most often, it is a tool for quick trading. For the long-term perspective, fundamental factors are taken into account.
The most informative type of chart is considered to be Japanese candlesticks. From this article you will learn about the features of their formation and interpretation (reading).
What is a Japanese Candlestick Chart
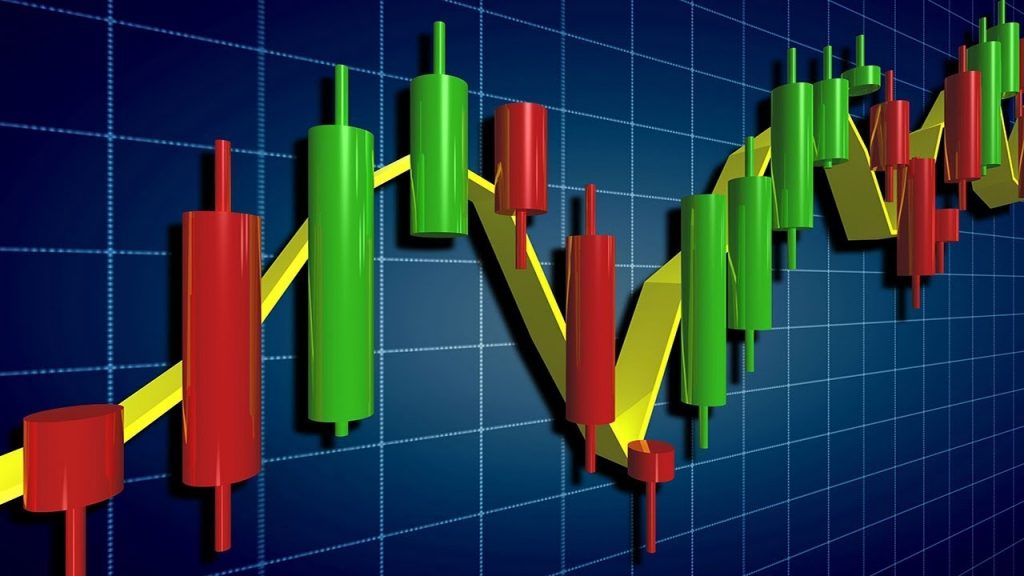
A candlestick shows how the asset’s value has changed over a specific period of time. The chart shows the minimum and maximum price for a specified period, as well as the price when opening and closing a deal.
The difference between a candlestick model and a regular linear model is in the informativeness of the former. A linear technical indicator only shows the cost of the last transaction.
How to read Japanese candlesticks
The elements of a candle are the body and the shadows, which are also called wicks.
The body reflects the distance the price travels from the opening to the closing of the interval, i.e. from the first to the final transaction. The task of the wicks is to demonstrate the minimum and maximum values to which the price reached.
Japanese Candlesticks: Three Basic Types
Traders decode candles based on their position:
- growing – the opening price is lower than the closing price;
- falling – on the contrary, at the opening the price is higher than at the final stage;
- Doji – the opening and closing are almost or absolutely the same.
What are timeframes
The timeframe is the period during which the candle is formed. Its duration varies from a minute to a quarter, and sometimes even up to twelve months. If, for example, you set an hourly timeframe on the trading platform, the candlestick chart will show the price change after every sixty minutes.
Japanese candlesticks signals shapes and sizes
The size of the candle body indicates how strong the buyers or sellers are. The more buyers the market has, the higher the rising candle. The more sellers, the lower the falling pattern.
Автор Evgeniy
IT entrepreneur. I consult the Buycrypt team on organizing a decentralized economy. I develop a strategy for bringing the token's value proposition to the market. I work on mathematical models: - increasing the efficiency of fund trading using the method of collective decision-making. - trader's IQ for weighing the impact on a collective decision. - calculating the fairness of income and contribution distribution. - predictive algorithm based on mass reactions. - decision-making system and organization of input/output of assets.