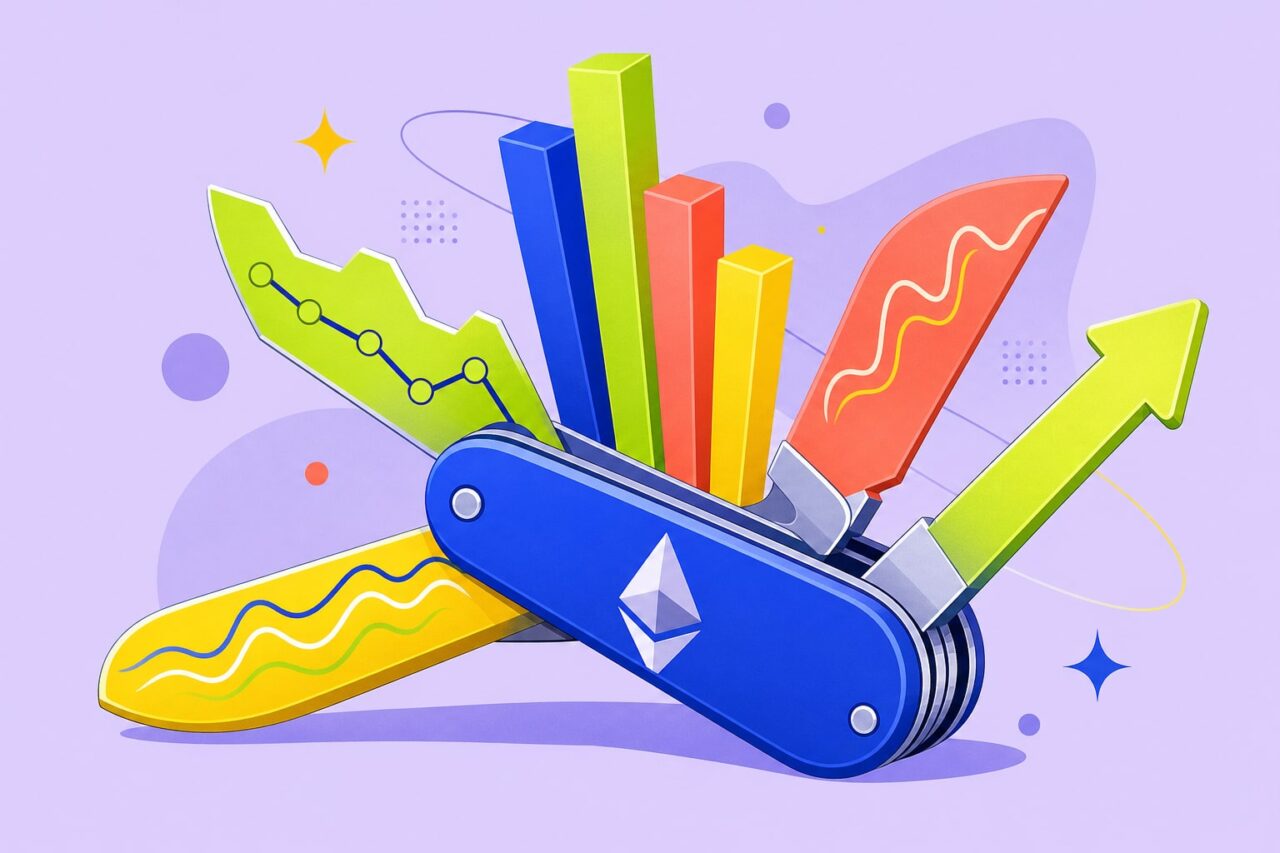
Best crypto charts to use vary based on individual needs. For detailed charting analysis, TradingView is a great option. Exchanges also have their own charts for users, which can be accessed directly through exchange platforms. Aggregator websites are also useful when you want to get an overall view of how a particular asset is performing. Coinglass has great data when it comes to derivatives trading.
TradingView
TradingView is a popular platform used for crypto charting. You can use TradingView to access charts of various assets, including data from your preferred crypto exchanges. This gives you the option to compare charts across different markets.
TradingView offers many charting tools that are typically used by crypto traders. This includes candlestick charts, line charts, Heikin Ashi, volume charts, as well as moving averages, RSI, MACD, Bollinger Bands, trend lines, support and resistance lines, and many other indicators. Multi-chart layouts are also possible with TradingView.
The platform also supports alerts, as well as apps for mobile trading. TradingView’s free plan is quite useful if you are looking for a charting tool. However, free plan users might be limited in some features such as indicators, multi-chart layout, number of alerts, and more. Paid plans allow for more charts and other features to be used. The price of TradingView, as well as its features for free users can change over time. Users should check the subscription plans carefully before subscribing.
TradingView is best for traders who want to use a platform to analyze charts and perform technical analysis. With many charting options and tools, TradingView allows traders to add annotations and use a wide variety of indicators. You can view charts from different exchanges to compare data. However, it is important to note that using TradingView or any charting platform does not necessarily make your technical analysis more accurate. The indicators that are offered by TradingView are based on the existing market data. In other words, they are based on the current or past market data, which can give misleading signals.
Exchange Charts
Crypto exchanges like Binance, Bybit, OKX, and Coinbase Advanced all offer charts that can be used by traders. The main advantage of using a chart from an exchange is that you can directly use this chart to place an order.
While some exchanges use TradingView or similar charting tools, others might offer charts combined with other exchange data such as order book, market depth, volume, derivatives data, and more. However, the features of these exchanges are subject to change based on the exchange and the platform that you use.
| Exchange | Data Source | Chart Features | Best fit |
|---|---|---|---|
| Binance | Binance market data | Chart indicators, drawing tools, volume, order book and more | Traders who are using Binance exchange |
| Bybit | Bybit market data | Chart indicators, drawing tools, derivatives data and more | Traders who are using Bybit exchange |
| OKX | OKX market data | Chart indicators, drawing tools, depth and order features and more | Traders who are using OKX exchange |
| Coinbase Advanced | Coinbase market data | TradingView-based charting tools, indicators and more | Traders who are using Coinbase Advanced |
The charts that are provided by exchanges are usually the charts for the market on that exchange. For example, the Bitcoin chart on Binance may have different volume, price spread, and even candlestick shapes compared to the same chart on Bybit or OKX or Coinbase Advanced. This is because each exchange has its own order book and the charts are formed based on the orders in that order book.
It is usually possible to access charts from exchange mobile apps and view charts, place orders, and get price alerts. This means that you can directly place an order from your mobile app and this can be convenient for traders. However, it also means that you might end up making quick decisions without the right plan.
Aggregators
Aggregator websites such as CoinGecko and CoinMarketCap offer charts for crypto assets. They allow traders to check price, market capitalization, trading volume, historical performance, and more. You can also see the different exchanges where a crypto asset is listed. This data is collected from multiple exchanges to provide a view of the market as a whole and not just one particular exchange.
These websites are great when you want a quick look at the market as a whole. For example, you might be interested in seeing whether a crypto asset is being widely traded, or what its market capitalization is compared to other tokens. You can also use these charts to check the performance of a crypto asset over time. Compared to TradingView or charts on an exchange, these websites offer relatively few charting tools and technical indicators.
- Use CoinGecko charts to check price, market capitalization, volume, and exchanges where an asset is listed
- Use CoinMarketCap charts to check price, market capitalization, volume, and other data for an asset
- You can also check individual exchange charts for price and other data when you plan to make an order
It should be noted that the data provided by these aggregator websites is not exactly the same. Different websites list different exchanges, which means that the price and volume data might be different. This is also because of different liquidity, order books, and data on each exchange at a given time.
Coinglass
Coinglass is not a charting platform in the sense that you can use it to draw charts. It focuses on data for derivatives trading. This includes charts for data such as open interest, funding rates, liquidations, and futures volume, among others, for various exchanges.
Open interest is a metric used to measure the number of outstanding positions in the derivatives market. The chart depends on the metric that you are viewing. Funding rate refers to the payments made periodically between traders in a perpetual futures contract. Liquidations are when a position is automatically closed because the trader does not have enough margin to cover losses.
These metrics and data can be useful to traders in many ways. For example, if the price of a crypto asset changes suddenly, you can use Coinglass to check the change in open interest to understand what might be happening with the market.
Coinglass is best used in conjunction with a chart from TradingView or the exchange. The Coinglass chart will help you understand the derivatives market, while the other chart will help you understand the price action. You can use Coinglass with its free plan, but there might be some features which require a paid plan. This might include access to historical data and advanced dashboards, for example.
Chart Types and Timeframes
Note: changing the chart type will not affect the market in any way, it will not make a coin less or more volatile in any way
Candlestick and Line Chart Views
A candlestick chart shows the opening, highest, lowest and closing prices of each chosen time period. It is a popular charting option as it is easy to understand a candlestick chart – it shows the direction of the market and the range in which the price has moved in that particular period.
A line chart is usually a graph made by plotting closing prices. It gives you a general idea of the overall trend, but you cannot see the high and low price within that time period.
Heikin Ashi and Depth Charts
The Heikin Ashi chart recalculates the values of the candlesticks in order to provide a smoother price graph. While this may make trends more apparent on the chart, it is important to remember that the open and closing values displayed on the Heikin Ashi chart are not the actual values of the asset.
A depth chart shows the buy and sell orders on an order book. However, these are not fixed orders, as they can always be cancelled or moved. So, a depth chart is useful in giving you a snapshot of the current market.
Choosing Timeframes
For example, a five-minute chart will provide you with information on the short-term movement, while a four-hour chart or a daily chart will give you a much broader picture of the market. Having a look at multiple timeframes can help you figure out whether a price movement is just temporary or part of a larger trend.
How To Choose a Charting Tool
The best way to go about choosing a charting tool is to first think about what you want to achieve. If you want a platform that allows you to use a wide variety of indicators and drawing tools, and receive alerts and plot multiple charts on the same screen, then TradingView is an obvious choice. If you want to analyse a chart alongside your order entry, then an exchange’s chart interface might be more useful.
CoinGecko and CoinMarketCap are good choices if you just want to quickly look up data on a particular coin aggregated from multiple sources. Coinglass provides additional derivatives market information such as funding rates, open interest, liquidations, and more. It’s important to note that many traders will use more than one charting tool, as each one provides a slightly different picture of the market.
- Ensure that the chart is powered by the data from a single exchange or multiple exchanges
- Make sure the platform has the indicators and drawing tools that you need
- Check out what alerts are available on desktop and mobile
- Compare the free plan with the features you actually need
- Ensure the charting tool has separate views of spot, futures or perpetual markets
None of the charting platforms can remove the risk from trading. These tools also make use of various indicators based on mathematical formulas that take into account price, volume, derivatives information, etc. Different platforms will have different versions of these indicators. The point of using a charting tool is to help you learn more about the market and analyse the price, but it will not guarantee any particular outcome.
Practice With BuyCrypt
At BuyCrypt, you can practice your chart reading skills with real market data using our crypto trading simulator. You can use our multi-exchange crypto terminal and view real-time crypto prices on our Markets pages. Read our crypto paper trading guide and demo trading guide to learn more about how to use our simulator.
BuyCrypt is not an exchange and cannot be used to buy or sell crypto. We offer an educational and gamified platform where users can join free crypto trading tournaments and demo contests. Using our simulator, our users will be able to trade with a simulated balance and access real market data. Our free crypto trading tournaments can be used to win real USDT prizes without requiring users to deposit any money. If you prefer a prop trading plan, we offer those too – starting at 49 USDT. You can also earn free prop plans by participating in our ‘The Ladder’ trading tournaments. Once you pass the evaluation, you will get a $5000 funded account where you can keep 80% of the profits you make. We confirm all our payouts on-chain in USDT.
Note that all trading on BuyCrypt is simulated and based on your skills, and should not be considered as financial or investment advice. Performing well in BuyCrypt’s demo trading simulator or crypto trading tournaments does not guarantee that you will perform well or be profitable in the real markets.
FAQs
What is the best crypto chart to use?
TradingView is an excellent choice if you want to use a charting tool for its wide variety of indicators, drawing tools and alert systems, and ability to display multiple charts simultaneously. The chart interface of an exchange is a good choice if you want to perform your market analysis and enter orders on the same interface.
Are the charts on exchanges better than TradingView?
Neither charting option is necessarily better than the other. Exchange charts can be used to get a view of the data on one specific exchange and allow you to enter orders alongside your charting. TradingView on the other hand is a much more customisable platform that also allows you to perform market analysis across multiple exchanges.
Are charts on CoinGecko and CoinMarketCap reliable?
These charts give a good idea of the price and volume and market-cap of a coin as they aggregate information from multiple exchanges. However, you may notice some slight differences in the chart on these sites, as they collect their data from different exchanges and use different methods of calculation.
What is the chart on Coinglass?
Coinglass is a charting tool that focuses specifically on derivatives market information. It provides information about the open interest, funding rates, liquidations and futures trading across exchanges for a coin.
What timeframe should I use for crypto charting, as a beginner?
There is no best timeframe for charting – you will have to figure out what works for you. However, looking at a shorter timeframe chart alongside a four-hour or a daily timeframe chart can help you differentiate between noise and the general trend of the market.
Keep reading: Markets · practice risk-free · the multi-exchange terminal
Discussion
Comments from BuyCrypt Live. Sign in with Google or Apple — we create your BuyCrypt account on the way, the same one as in the app.